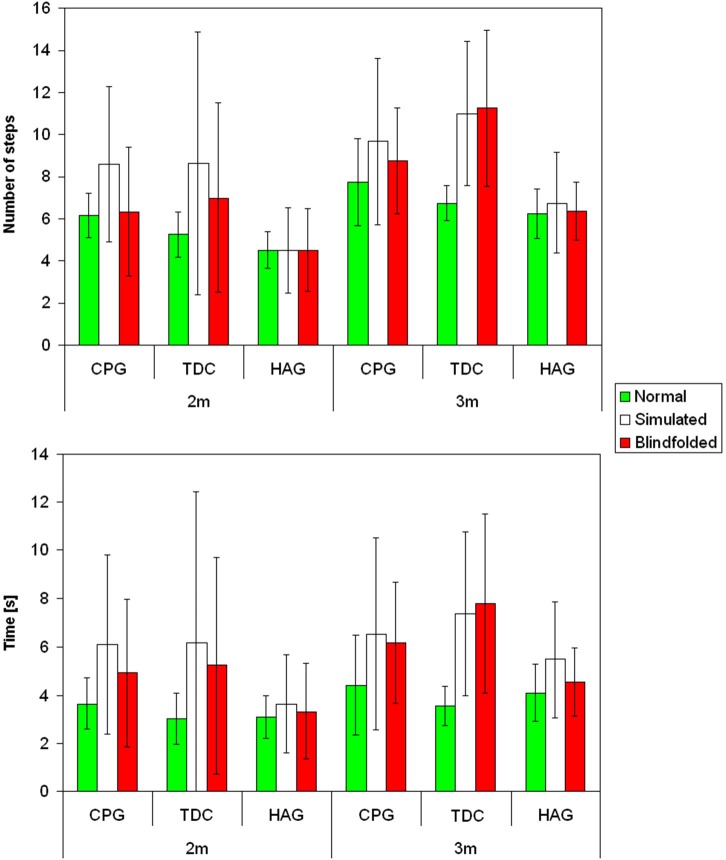
Figure 1.
Mean and standard deviations for the number of steps (above) and movement time (below) for children with cerebral palsy (CCP), typically developing children (TDC) and healthy children group (HCG) during normal (green), simulated (white) and blindfolded (red) walking for the two tested distances.

