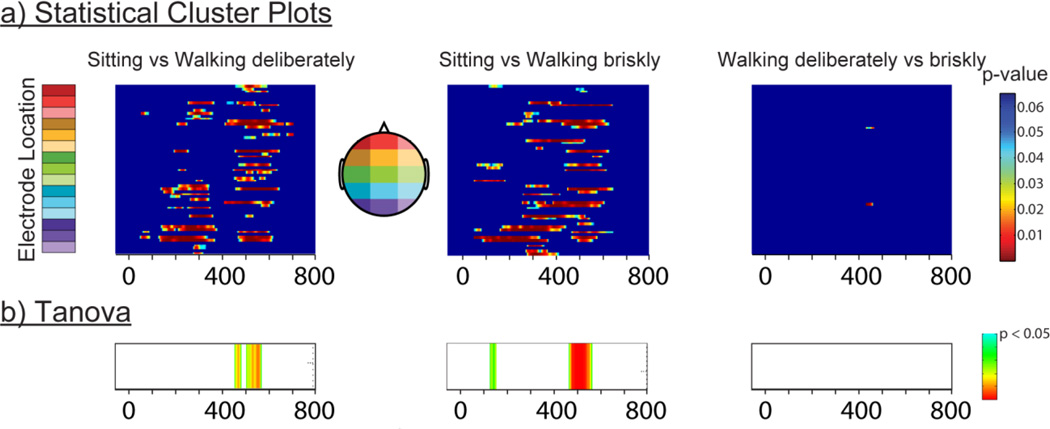
Figure 6.
a) Statistical cluster plots (top row) assessing onset and distribution of differential ERP responses between sitting versus the two walking conditions (deliberately & briskly) and between walking deliberately versus walking briskly. Color values indicate the result of point-wise t-tests evaluating the differential activation across the 900ms time epoch (x-axis) and 64 electrode montage (y-axis; see Materials and Methods for details of electrode locations). For clarity, only p values < 0.05 are color-coded, and only then when fifteen consecutive data points (30 ms) exceeded this criterion. b) TANOVA (bottom row) assessing periods of statistically significant topographical differences between conditions.

