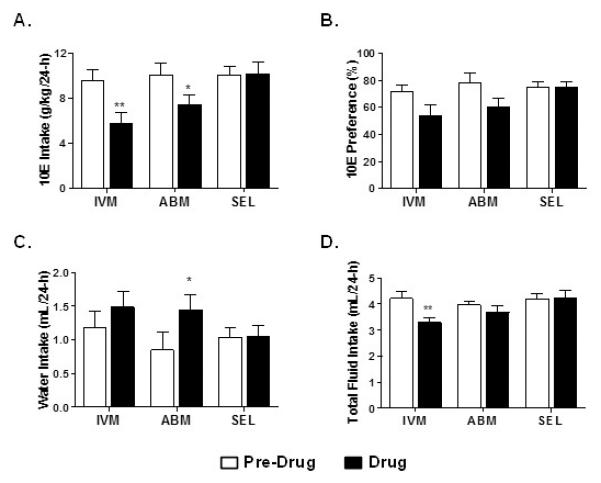
Fig 2. IVM, SEL, ABM (5 mg/kg) administration in male C57BL/6J mice using a 24-h access two-bottle choice paradigm.

Bars represent levels from the saline control the day prior to drug injection (Pre Drug) and the day of the drug injection (Drug) for A) 10E intake, B) preference for 10E, C) water intake, and D) total fluid intake. Values represent the mean +/− SEM for 7-8 mice per dose group. *P<0.05, **P < 0.01 versus respective pre drug condition.
