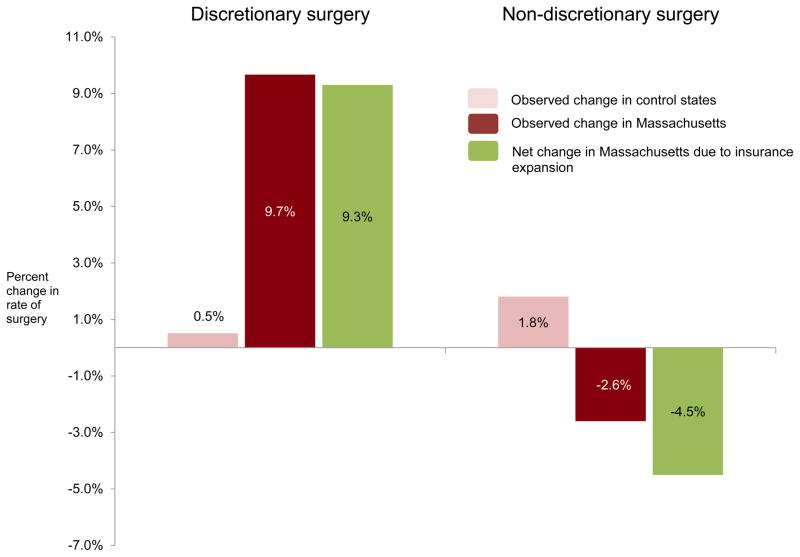
Figure 1. Changes in discretionary and non-discretionary surgery after insurance expansion in Massachusetts.
Bar graphs represent percent change in the mean rate of discretionary and non-discretionary surgery from before to after Massachusetts healthcare reform (July 2007). Control states are New Jersey and New York. Net change in Massachusetts due insurance expansion was determined using multivariable difference-in-differences analysis and represents change in rate of surgery attributed to insurance expansion.

