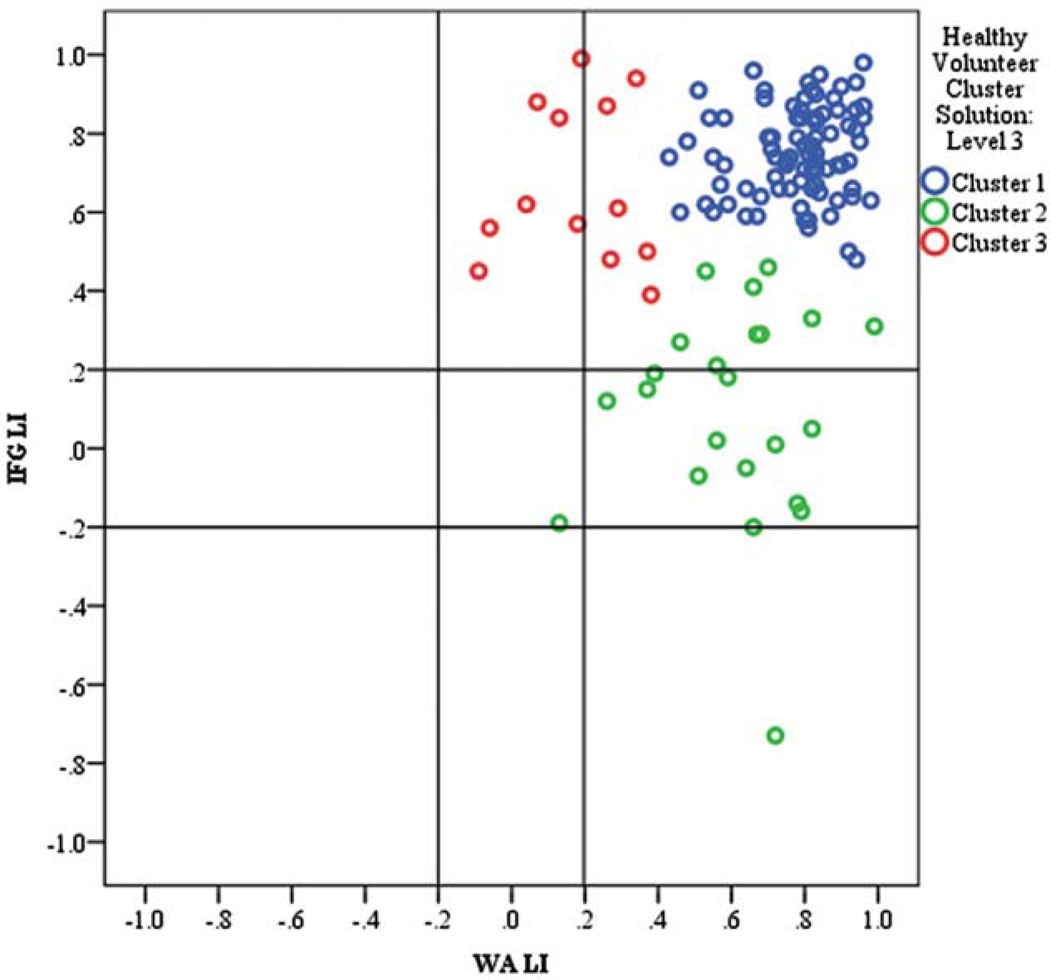
FIGURE 5.
Cluster analysis of typically developing controls revealing 3 clusters of left dominance. Lines indicate thresholds for categorical thresholds of patterns. Colors indicate clusters. IFG = inferior frontal gyrus; LI = lateralization index; WA = Wernicke area. [Color figure can be viewed in the online issue, which is available at www.annalsofneurology.org.]

