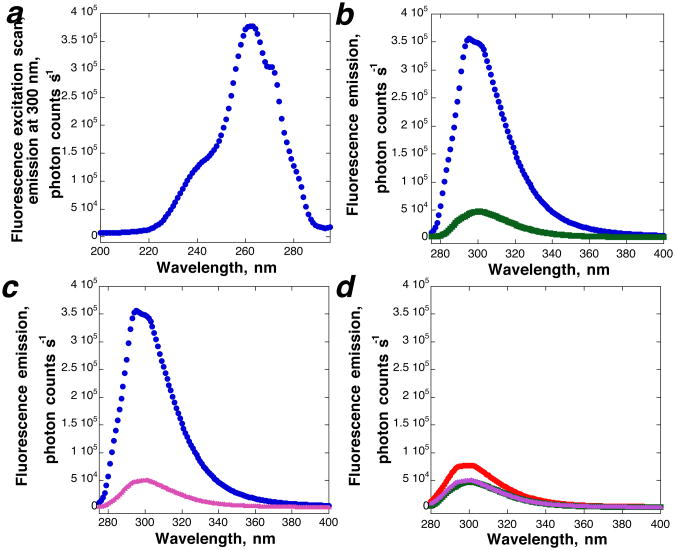
Figure 11.
Fluorescence of peptides in 5 mM HEPES buffer pH 7.5 with 100 mM NaCl and 2 mM MgCl2. Data were collected with band widths of 3 nm. (a) Fluorescence excitation spectrum of Ac-TAP(4S-OPhCN)N-NH2(145) with detection of emission at 300 nm. (b) Fluorescence emission spectra of Ac-TAP(4S-OPhCN)N-NH2 (blue circles) and Ac-TYPN-NH2 (green squares) (50 μM peptide) with excitation at 265 nm. (c) Fluorescence emission spectra of Ac-TAP(4S-OPhCN)N-NH2 (blue circles) and Ac-TYP(4S-OPhCN)N-NH2(36) (magenta triangles) with excitation at 265 nm, showing the effect of tyrosine in quenching fluorescence. (d) Fluorescence emission spectra of Ac-TYP(4R-OPhCN)N-NH2(35) (red circles), Ac-TYP(4S-OPhCN)N-NH2(36) (magenta triangles), and Ac-TYPN-NH2 (green squares). The fluorescence emission spectra of these peptides, with excitation at 265 nm and at 280 nm, with error bars, are in the Supporting Information.

