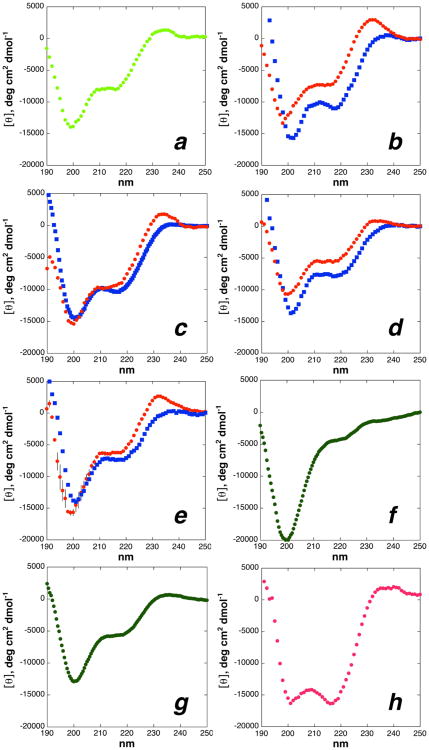
Figure 9.
CD spectra of TYXN peptides indicating the effect of proline substitutions on modulating peptide conformation. (a) Ac-TYPN-NH2; (b) Ac-TYHypN-NH2(1) (red circles) and Ac-TYhypN-NH2(4) (blue squares); (c) Ac-TYFlpN-NH2(27) (red circles) and Ac-TYflpN-NH2(26) (blue squares); (d) Ac-TYP(4R-azido)N-NH2(18) (red circles) and Ac-TYP(4S-azido)N-NH2(21) (blue squares); (e) Ac-TYP(4R-OAc)N-NH2(58) (red circles) and Ac-TYP(4S-OAc)N-NH2(59) (blue squares); (f) Ac-TYP(4-oxo)N-NH2(91); (g) Ac-TYP(4,4-F2)N-NH2(101) and (h) Ac-TYP(4,4-dithiolane)N-NH2(102). CD data were collected in water with 25 mM KF and 20 mM phosphate pH 7.0. CD data were background corrected but were not smoothed. CD spectra with error bars are shown in the Supporting Information.

