
Figure 1.
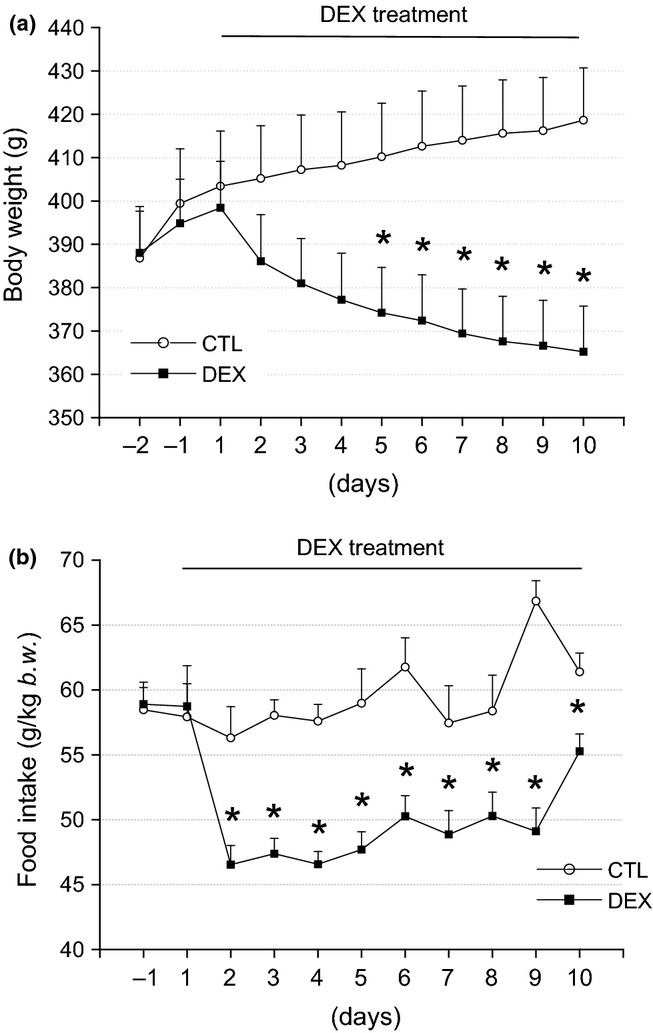
Reduced body weight and food intake in the DEX rats. In (a), the average body weight values during the DEX treatment. Observe the significant reduction of body weight in the DEX rats after the 4th day of DEX treatment compared with the CTL rats. In (b), the average food intake values during the DEX treatment. Note the significant reduction in the food intake after the first day of treatment in the DEX compared with the CTL group. These values remained reduced until the day before euthanasia. Data are presented as the means ± SEM *significantly different vs. control group using unpaired Student’s t-test (P < 0.05; n = 10).