Figure 2.

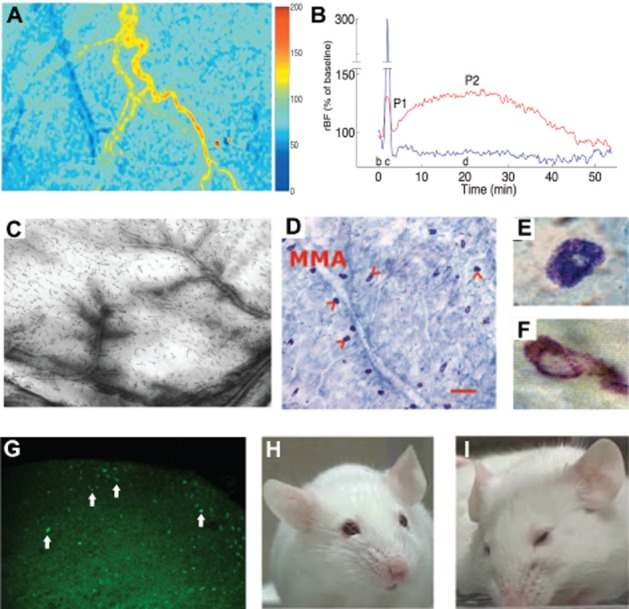
Activation of the TVS can be investigated with various techniques. (A) MMA blood flow: laser speckle images of the cortex, cortical blood vessels and MMA captured in a rat under anaesthesia illustrate the blood flow changes as two-dimensional relative flow maps. Cold colours indicate a decrease, whereas hot colours depict an increase in blood flow compared with baseline as shown in the scale bar on the right. Twenty minutes after induction of a single CSD with a pinprick, the cortex is hypoperfused (blue), whereas blood flow in the MMA is increased (yellow-red). (B) The MMA flow increase (red line) peaks around 20 min after CSD and lasts about 1 h during which the cortical blood (blue line) remains oligemic. (C) Plasma protein extravasation: leakage of i.v. administered HRP in a rat whole-mount dura preparation illustrates plasma protein extravasation from dural vessels after CSD. (D–F) Mast cell degranulation: incubation of dura with methylene blue reveals mast cells (arrowheads) along the course of MMA in a mouse; scale bar = 100 μm (D). Degranulated mast cells (F) can easily be distinguished from resting cells (E) with loss of blue cytoplasmic granules. (G) c-fos expression: Fos immunoreactivity appears in TNC 1 h after KCl-induced CSDs. Majority of the labelled cells (arrows) are located in the superficial layers (laminae I and II). (H, I) Pain-related behaviour: (H) normal mouse facial appearance, (I) facial expression of a mouse suffering from pain. A, B, C were reproduced from Bolay et al., 2002; D, E, F, from Karatas et al., 2013; and H, I; from Langford et al., 2010 with permission.
