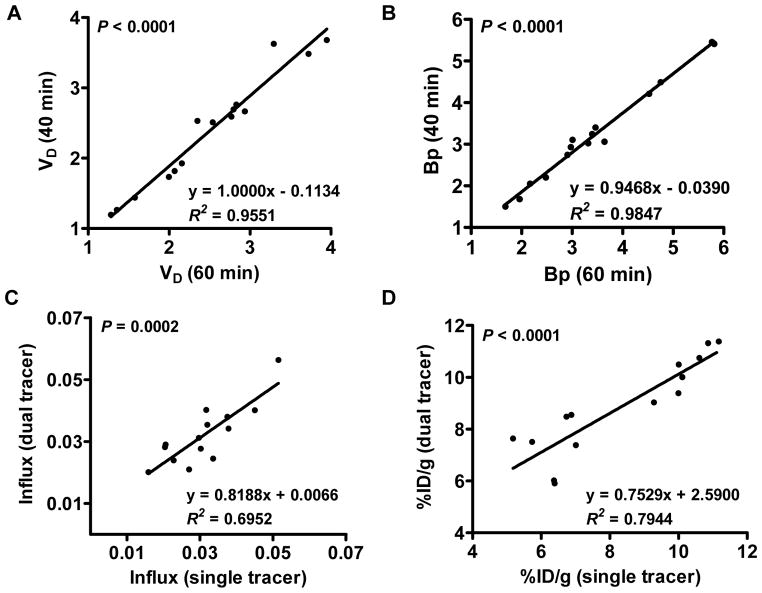
Figure 2.
(A & B) The correlation between dynamic parameters VD and Bp calculated from 60 min and 40 min 18F-Alfatide II TACs. (C & D) The correlation of 18F-FDG tumor influx rate (C) and tumor uptake (D) between single and dual tracer imaging. The linear regression equation, Pearson’s correlation coefficient R2and the P value of linear regression F test are shown.

