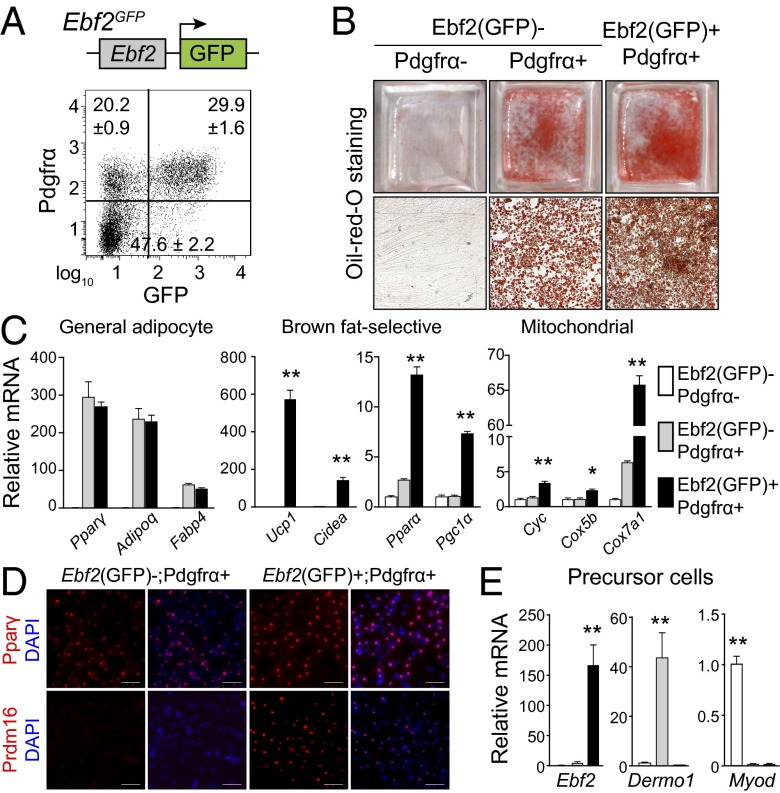
Fig. 2.
Prospective identification of Ebf2+ brown adipogenic precursors. (A) Cells from E14.5 Ebf2GFP embryos were fractionated based on GFP and Pdgfrα expression. The percentages of each population are reported as mean ± SD, n = 3. (B) Flow-sorted cell populations (from A) were induced to undergo adipocyte differentiation and stained with Oil Red O. (Scale bar, 100 µm.) (C) mRNA levels of general adipocyte markers, brown-fat–selective genes, and mitochondrial genes in indicated cultures. Values are mean ± SD, n = 3; *P < 0.05, **P < 0.01. (D) Immunofluorescence staining of Pparγ and Prdm16 in indicated cell cultures. (Scale bar, 50 µm.) (E) mRNA levels of Ebf2, Dermo1, and MyoD in freshly sorted cell fractions. Values are mean ± SD, n = 3; *P < 0.05, **P < 0.01.

