Fig. 3.
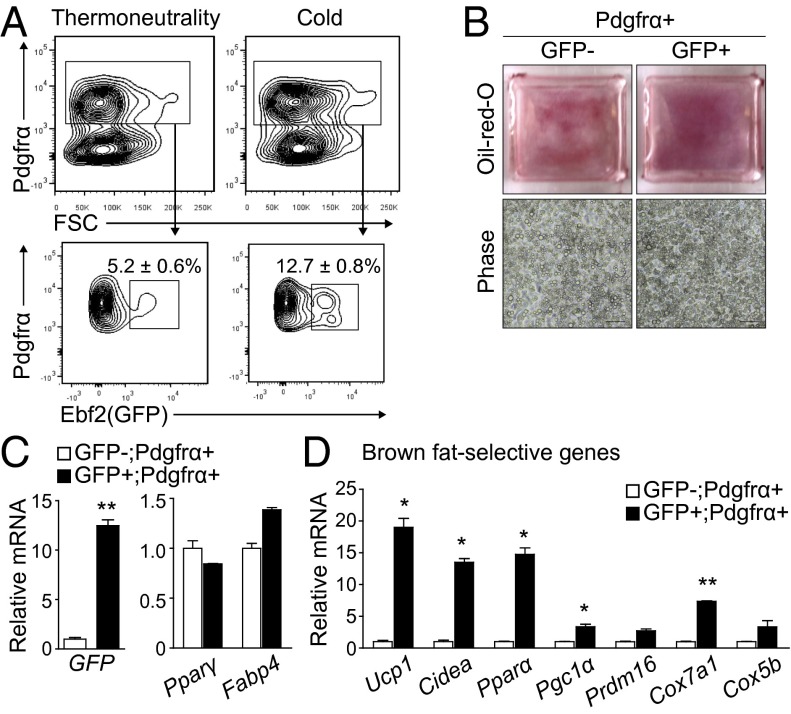
Ebf2 marks beige adipogenic precursors in WAT. (A) FACS plots and percentage of stromal cells expressing Ebf2-GFP in iWAT from mice housed at thermoneutrality (30 °C) or cold (4 °C) for 3 d. FSC, forward scatter. The percentage is mean ± SD, n = 3 (six mice per experiment). (B) Sort-purified cell populations from iWAT were induced to undergo adipocyte differentiation and stained with Oil Red O. (C and D) mRNA levels of Gfp, general adipogenic genes, and (D) brown-fat–selective genes in cell cultures from B. Values are mean ± SD, n = 3; *P < 0.05, **P < 0.01.

