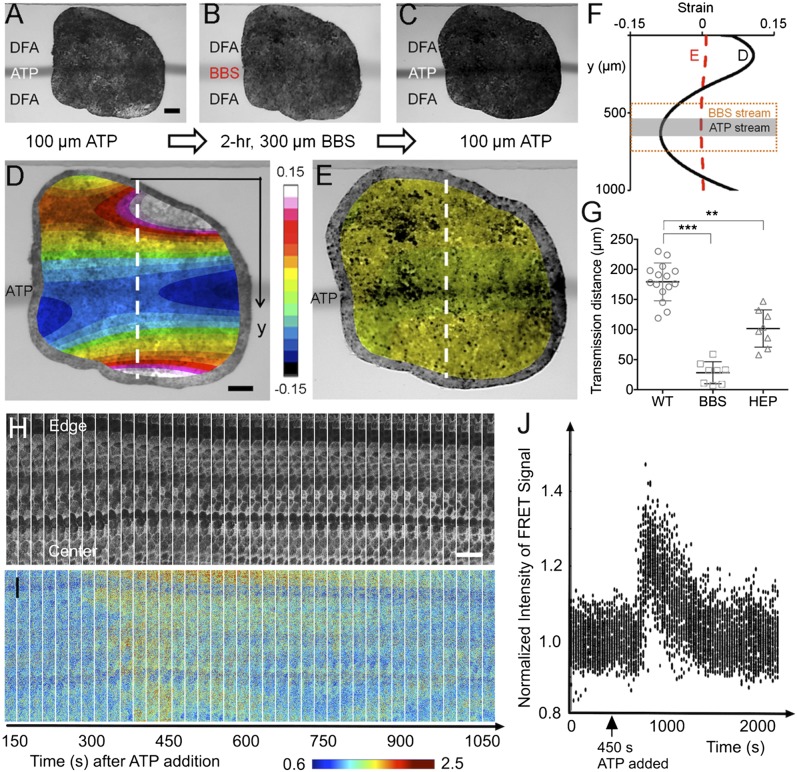
Fig. 3.
Mechanochemical contractile signals through mechanical versus chemical cues. (A) Localized contraction was first triggered with a 100-μm ATP stream for 20 s at t = 0 s. (Scale bar: 100 μm.) (B) To disrupt actomyosin mechanical connections, this localized stimulation was followed by a 2-h BBS; actomyosin inhibitor) exposure to a 300-μm-wide lane that covers the location that the 100-μm ATP stream had previously stimulated (Fig. S4). (C) The same 100-μm ATP stream was applied for 20 s at t = 2 h immediately after the BBS was removed. (D) Image of a tissue overlaid with the strain map for the maximum contraction (at 40 s after the stimulation ends) of the tissue before being treated with BBS during ATP stimulation. (Scale bar: 100 μm.) (E) Image of the tissue overlaid with the strain map after being treated with BBS and then the ATP applied. (F) Effect of actomyosin inhibition on strain distribution in a tissue locally exposed to extracellular ATP. The black solid line is the initial strain distribution in the tissue from D when stimulated with 100-μm stream of extracellular ATP (indicated in dark gray). The red dashed line is the strain distribution in the tissue from E when stimulated with 100-μm stream of extracellular ATP after being exposed to BBS for 2 h, indicating almost no contraction after the addition of BBS that inhibits actomyosin activity. (G) Effects of actomyosin activity and gap junction on contractile signal transmission distance using BBS and HEP (gap-junction uncoupler). (For the detailed HEP experiments, see Materials and Methods and Figs. S7 and S8.) Error bars represent SDs (** indicates P < 0.01, *** indicates P < 0.001). (H) Maximal projection images from time-lapse confocal stacks in the donor emission channel show the morphology of the epithelial cells near their apical face and the expression of the biosensor. (Scale bar: 50 μm.) (I) Intensity of the FRET signal (Emission Acceptor–Emission of Donor) in the same sequence reveals that the Ca2+ response begins ∼175 s after the start of the sequence, or 275 s after addition of ATP to the chamber, and sweeps from the exposed edge of the explant toward the center of the explant. (J) Normalized intensities of the FRET signals tracked within individual cells over time show that the spike and subsequent decay of calcium activity last ∼10 min. Values in the graph represent average signal intensity of subdomains within the images normalized to the average intensity of the images before ATP addition. This result shows that tissue contraction corresponds to an influx of calcium within the responding tissues.

