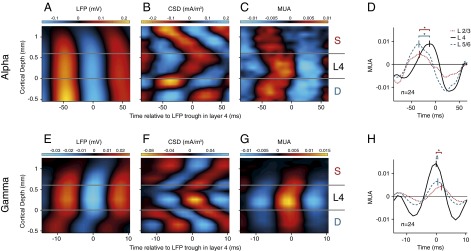
Fig. 3.

Laminar profile of cortical oscillations. To determine the average laminar profile of the LFP, CSD, and MUA relative to the α- and γ-oscillations, we aligned the data to the troughs of the LFP in layer 4. (A) Laminar profile of the LFP (mV) relative to the α-troughs in a window from 150 to 300 ms after stimulus onset, averaged across 24 penetrations. The LFP was relatively homogeneous across the layers. Negative potentials are shown in blue, positive potentials in red. (B) Average laminar profile of the CSD (mA/m3) relative to LFP troughs in layer 4 for the α-rhythm. Current sinks are shown in red, sources in blue. (C) MUA aligned to the LFP troughs in layer 4. Red colors show MUA that is higher than the average and blue colors show that MUA lower than the average. The MUA was normalized to the visually driven activity 150–300 ms after stimulus onset. The scale therefore denotes the fraction of the visually driven MUA response that synchronized to the LFP troughs in layer 4 in the 8- to 12-Hz frequency range. (D) Average MUA (n = 24 penetrations) in layer 2/3 (red dotted curve), 4 (black continuous curve), and 5/6 (blue dashed curve) relative to the trough of the α-wave in layer 4. *Significant difference in phase (t test, P < 0.005). (E–H) Same analysis as in A–D, but now the data were aligned to the troughs of the γ-rhythm (55–65 Hz) in layer 4.
