Fig. 6.
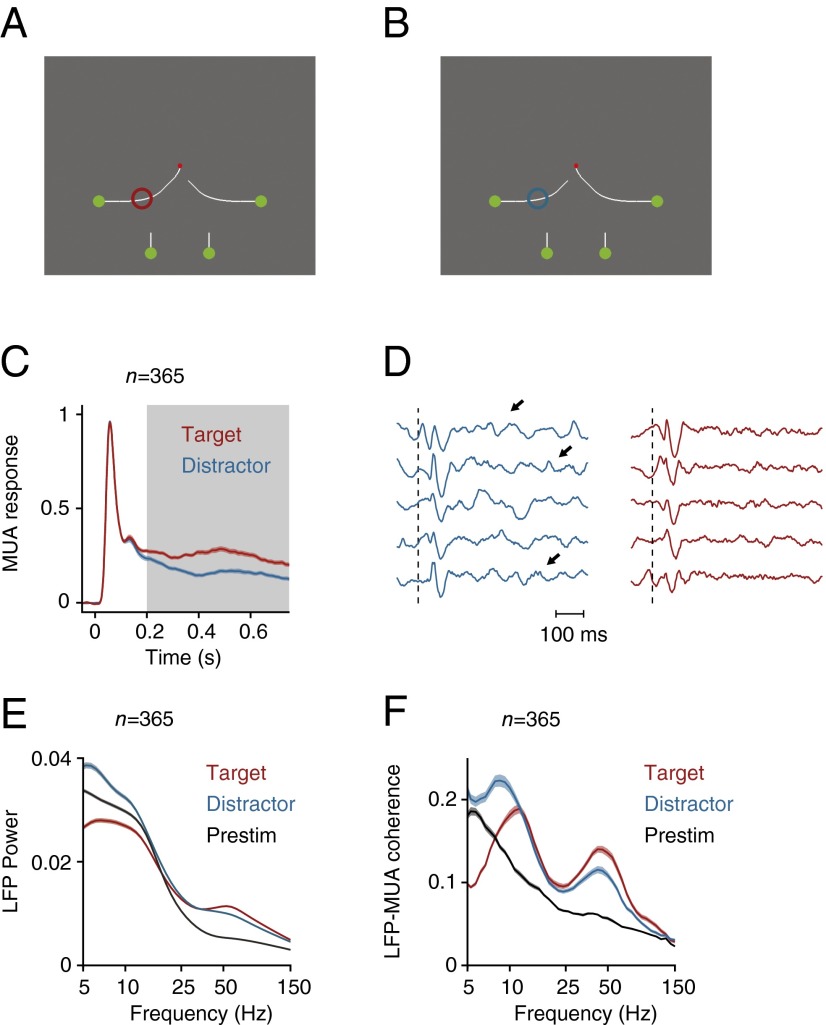
Curve-tracing task where the monkey had to mentally trace the target curve that was connected to the fixation point. (A and B) We placed either the target curve (A, red circle) or one of the distractor curves in the RF (B, blue circle). (C) Neuronal activity averaged across all V1 recording sites in two monkeys evoked by the target (red trace) and the distractor curve (blue trace). Gray area highlights the time window for spectral analysis (200–750 ms after stimulus onset). (D) Example LFP responses in successive single trials elicited by the target (red) and distractor curve (blue). Dotted line indicates the stimulus onset, arrows point to low frequency oscillations. (E) LFP power spectrum elicited by the target and distractor curve and during prestimulus period (200–0 ms before stimulus onset) (black trace). (F) LFP–MUA coherence evoked by the target and distractor curve during the epoch of response modulation (200–750 ms after stimulus onset) and during the prestimulus period (black trace). Shaded areas show SEM in all plots (n = 365 recording sites), when they are difficult to see the SEM is small.

