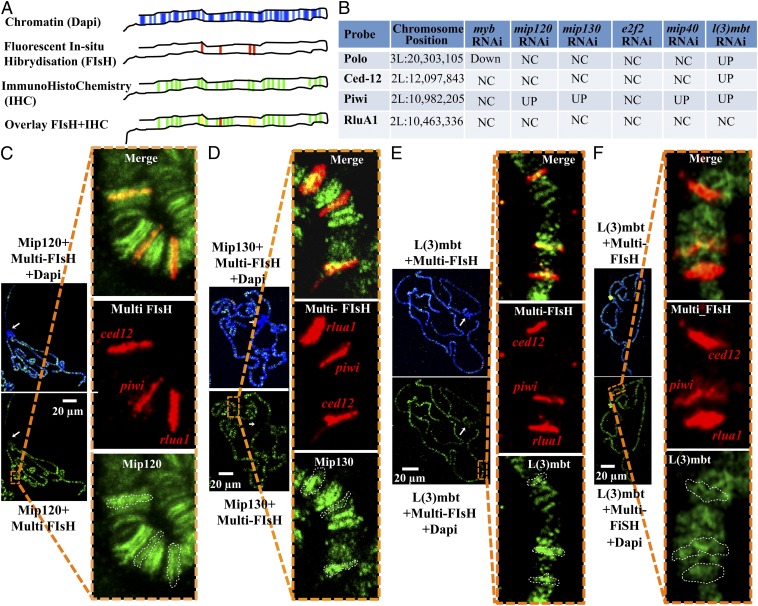
Fig. 6.
Fluorescent in situ hybridization barcoding. (A) Diagram of the combination of FISH barcoding and IHC. (First row) Polytene chromosomes are stained with Dapi to identify centromeric heterochromatin and general arm geography. (Second row) Subset of promoters is labeled by FISH with a single fluorophore; by comparing them to the signal obtained with Dapi, it is possible to identify each individual band. (Third row) Protein of interest is labeled by IHC with antibodies conjugated to a second fluorophore. (Fourth row) Overlap of FISH with IHC allows the study of protein occupancy on the selected promoters. (B) Subset of four MMB and non-MMB targeted promoters (according to published data) were selected based on their relative position on the chromosome. (C and D) Polytene chromosome spread from wild-type third instar Drosophila larvae stained with Dapi (blue), by FISH against the promoters indicated above (in red) and by IHC using antibodies against MMB proteins (green). Insets correspond to a magnification of the indicated area of an overlay between FISH and IHC images. To better assess the promoter occupancy by each MMB protein tested, the contours of the band from each FISH signal were overlaid with the IHC signal (Lower Inset). (C) Rabbit anti-Mip120 + anti-rabbit Alexa 488 (green). (D) Rabbit anti-Mip130 + anti-rabbit Alexa 488 (green). (E) Rabbit serum anti-L(3)mbt + anti-rabbit Alexa 488 (green). (F) The same analysis as described above for E on polytene chromosomes from third instar larvae homozygous putative null mutant for mip1301-36.

