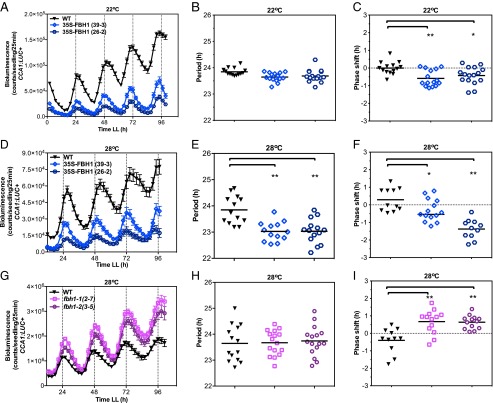
Fig. 2.
Homozygous seedlings were entrained in LD for 7 d at 22 °C and then were released either to LL at 22 °C (A–C) or to LL at 28 °C (D–I) and were imaged every 2.5 h for 5 d. Period and phase values were calculated using FFT-NLLS, and changes were calculated relative to WT. Values are shown as means ± SEM (n = 14–16). (A–C) Bioluminescence (A), period (B), and phase (C) values in CCA1:LUC+ (WT) and two independent FBH1-overexpressing lines, 35S-FBH1 (39-3) and 35S-FBH1 (26-2), at 22 °C. (D–F) Bioluminescence (D), period (E), and phase (F) values in CCA1:LUC+ (WT) and two independent FBH1-overexpressing lines, 35S-FBH1(39-3) and 35S-FBH1(26-2), at 28 °C. In E, period values (mean ± SD) were 23.84 ± 0.53 for WT, 22.93 ± 0.50 for 35S-FBH1(39-3), and 23.03 ± SD 0.47 for 35S-FBH1(26-2). (G–I) Bioluminescence (G), period (H), and phase (I) values in WT and FBH1 amiRNA lines fbh1-1 (2-7) and fbh1-2 (3-5) crossed to CCA1:LUC+ reporter lines at 28 °C. **P ≤ 0.001, *P ≤ 0.03; unpaired t test.

