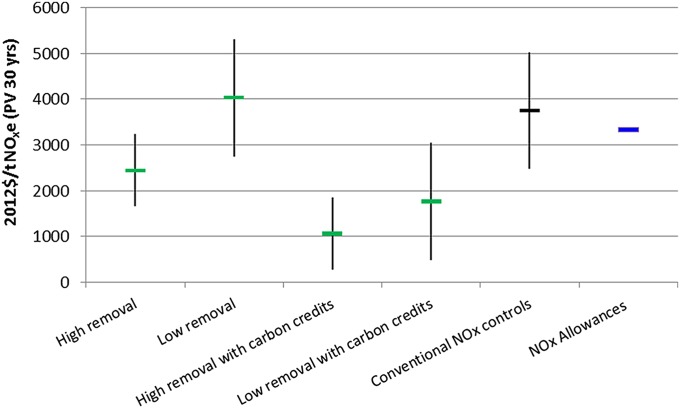
Fig. 1.
Average cost per ton of NOx control through reforestation at zero land cost, for high and low removal scenarios, and cost of standard point source controls and NOx stream allowances in the HGB area. Vertical lines indicate ranges caused by different cost assumptions. Costs expressed as PV over 30-y period. NOxe—NOx equivalent.

