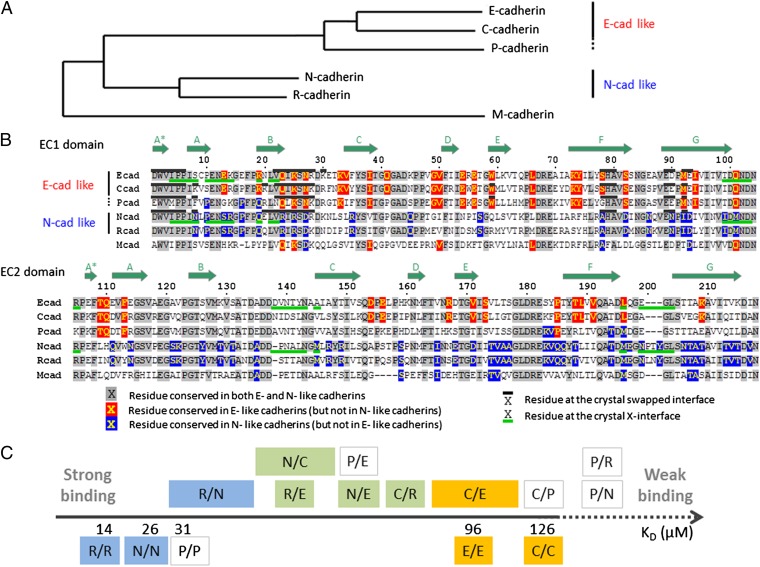
Fig. 2.
Sequence comparison of type I classical cadherins and scale of relative binding affinities. (A) Phylogenetic tree (obtained with the PhyML method; see Materials and Methods) of classical cadherins based on the EC1 domain sequences of mouse E-, P-, N-, R-, and M-cadherin, and Xenopus C-cadherin. (B) Sequence alignment of EC1 and EC2 domains. Subtype-specific residues are highlighted in red and blue, and conserved residues in gray. The swapped- and X-dimer interfaces are marked by black (above sequence) and green (below sequence) bars, respectively, when crystal structures are available. Positions of the β-strands are indicated by the arrows above the sequence. (C) Scale of homophilic and heterophilic binding affinities. Homophilic binding affinities, determined by AUC, are given as KD below the axis. Heterophilic interactions are indicated above the axis, and their specific order along the axis indicates their relative binding affinities, determined by SPR. In the case of the R/N, N/C, and C/E interactions, the relative order was not possible to fully determine, and larger boxes indicate the range of possible affinities. The interactions are colored according to whether they are among E-like cadherins (in orange), among N-like cadherins (in blue), or across subtypes (in green). Interactions involving P-cadherin are not colored.

