Fig. 1.
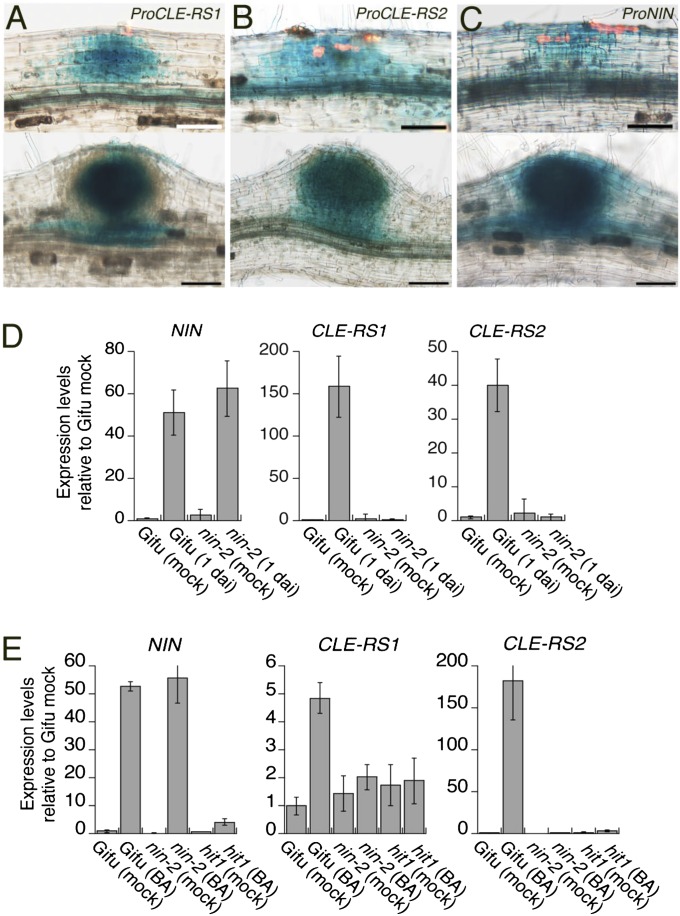
Expression analysis of CLE-RS1, CLE-RS2, and NIN. (A–C) GUS expression controlled by the CLE-RS1 (A), CLE-RS2 (B), and NIN (C) promoters in nodule primordia (Upper) and developing nodules (Lower). DsRed fluorescence in the upper panels represents infection foci. (Scale bars: 50 µm in Upper; 100 µm in Lower). (D and E) RT-PCR analyses of gene expression in roots. (D) Gifu B-129 (WT) and nin-2 were inoculated with (1 dai) or without (mock) M. loti. (E) Gifu B-129, nin-2, and hit1 were incubated in liquid media supplemented with (BA) or without (mock) 50 nM benzyladenin for 20 h. Expression levels were normalized to polyubiquitin expression. Data are mean ± SD of three biological repeats.

