Fig. 1.
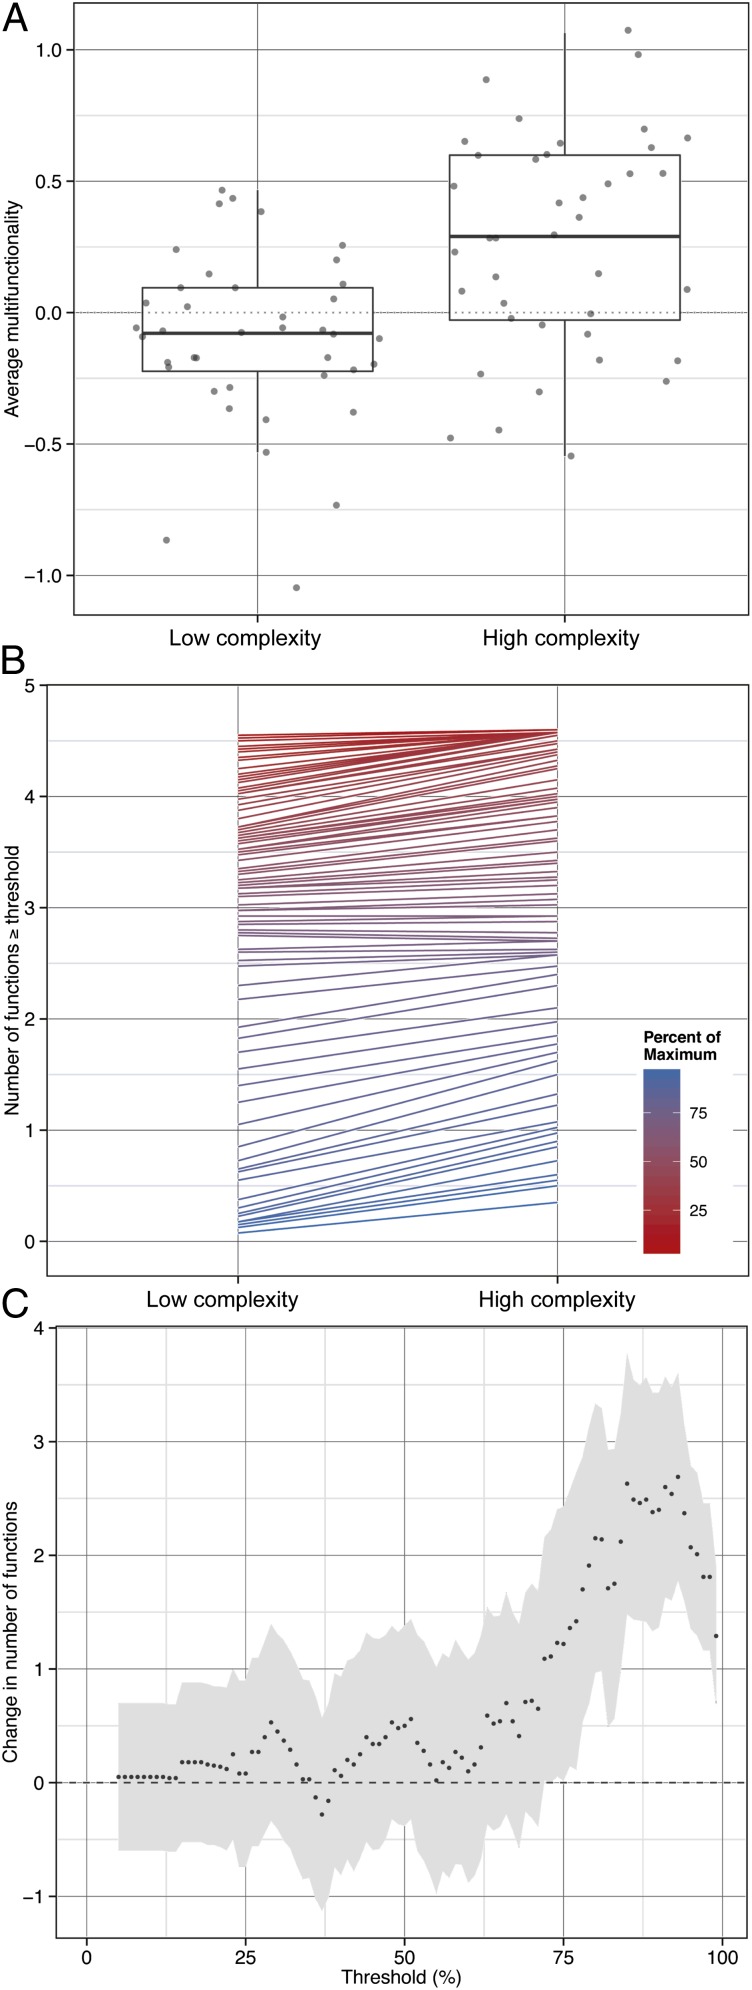
Loss of soil community functional complexity decreases multifunctionality when measured as (A) average multifunctionality or (B) the number of functions exceeding threshold levels of maximum process rates. Data points in A are jittered to visualize vertical spread, and represent average multifunctionality of each replicate at each of the four time points at which measures were taken. The horizontal line shows the median, the box the 25th and 75th percentiles of the data, and the extent of the whiskers 1.5 times the interquartile range. (B) Lines represent the slope between soil fauna loss and the number of functions greater than or equal to a threshold value. Separate statistical models were fit at each threshold ranging from 5 to 99% of maximum functioning, with blue lines indicating high percentages of maximum functioning and red lines indicating low percentages of maximum functioning. The curve in C indicates the change in the slope of the relationship described in B across all thresholds with the gray area showing SE. When the error does not cross the zero line (starting at 72%), the loss of soil community functional complexity is associated with a statistically significant decrease in ecosystem multifunctionality.

