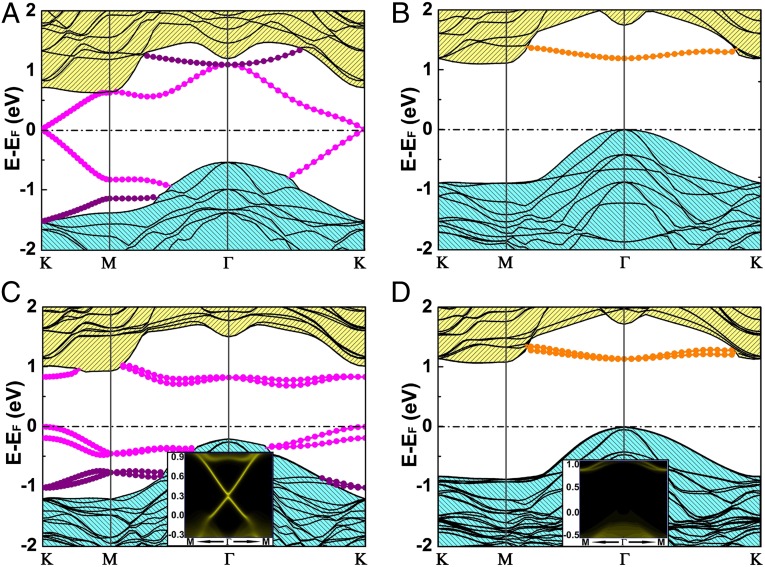
Fig. 2.
Band structures of Bi and Au on Si(111)-×-Cl surface for (A) Bi and (B) Au without SOC, respectively; (C and D) with SOC. Bands compositions near Fermi level are indicated. C, Inset, shows the Dirac edge states within the SOC-induced band gap in Bi@Cl-Si(111), and D, Inset, shows no edge states within the band gap of Au@Cl-Si(111). The brightness is proportional to the magnitude of the states.

