Figure 2.

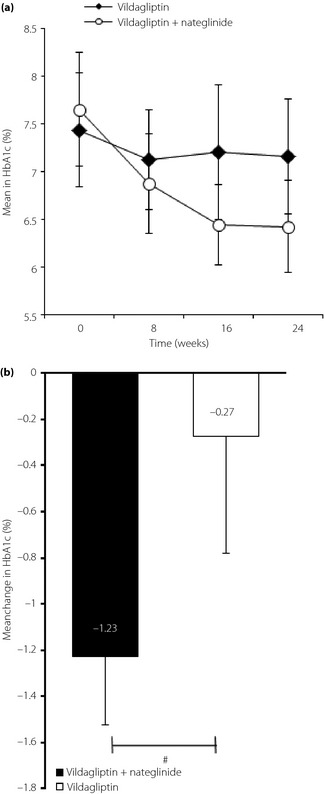
(a) Serial changes in glycated hemoglobin (HbA1c) during the 24 weeks with vildagliptin or vildagliptin + nateglinide. (b) Mean changes in HbA1c at the end‐point in the two treatment groups. #P < 0.001, the combination group versus the switching group.
