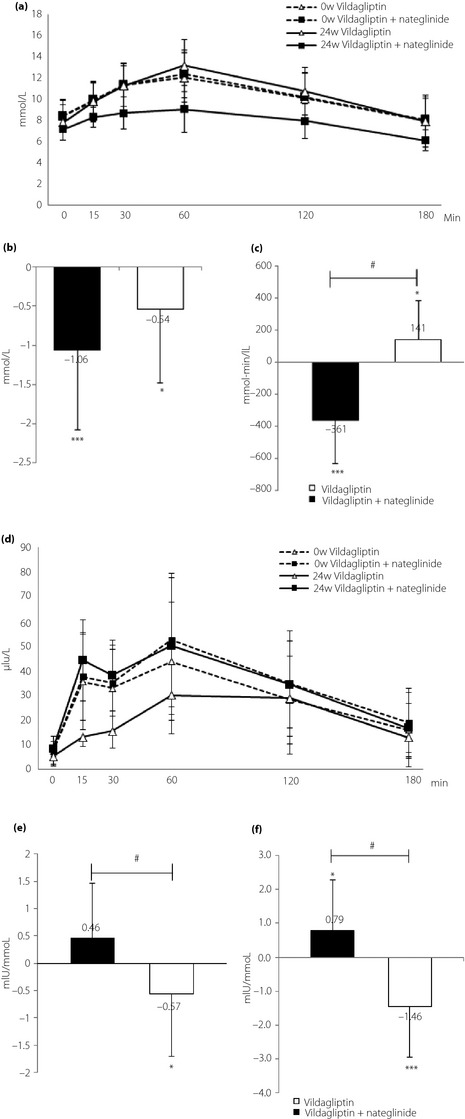
Figure 3.

(a) Serial changes in plasma glucose level at baseline with nateglinide and after 24 weeks with vildagliptin or vildagliptin + nateglinide after standard meal load. (b) Mean changes in fasting plasma glucose. ***P < 0.001, baseline versus 24 weeks in the combination group. *P < 0.05, baseline versus 24 weeks in the switching group. (c) Mean changes in areas under the curve of glucose from baseline to end‐point after standard meal load. #P < 0.001, the combination group versus the switching group. ***P < 0.001, baseline versus 24 weeks in the combination group. *P < 0.05, baseline versus 24 weeks in the switching group. (d) Serial changes in plasma insulin level at baseline with nateglinide and after 24 weeks with vildagliptin or vildagliptin + nateglinide after standard meal load. (e) Mean change in insulin secretion relative to glucose elevation after meal load (ISG0?180 min; AUC0?180 min insulin/AUC0?180 min glucose) from baseline to endpoint. #P < 0.01, the combination group versus the switching group. *P < 0.05, baseline versus 24 weeks in the switching group. (f) Mean change in ISG0–30 min from baseline to end‐point. #P < 0.001, the combination group versus the switching group. *P < 0.05, baseline versus 24 weeks in the combination group. ***P < 0.001, baseline versus 24 weeks in the switching group.
