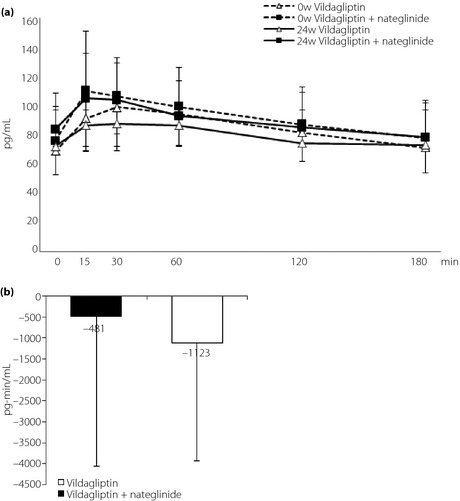
Figure 4.

(a) Serial changes in glucagon at baseline with nateglinide and after 24 weeks with vildagliptin or vildagliptin + nateglinide after standard meal load. (b) Mean changes of area under the curve of glucose from 0 to 180 min glucagon after standard meal load from baseline to end‐point.
