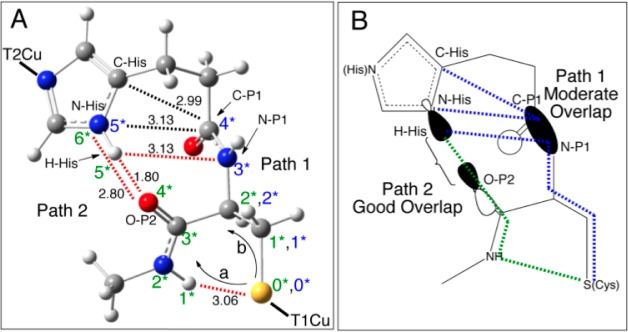
Figure 10.

P1 and P2 superexchange pathways: (A) the atoms involved in P1 and P2 (black dotted lines indicate through-space interactions and red dotted lines indicate H-bonding) and (B) relative orbital overlaps for the molecular orbitals in P1 and P2 (blue and green dotted lines indicate interactions for the blue and green T1 sites, respectively).
