
Figure 5.
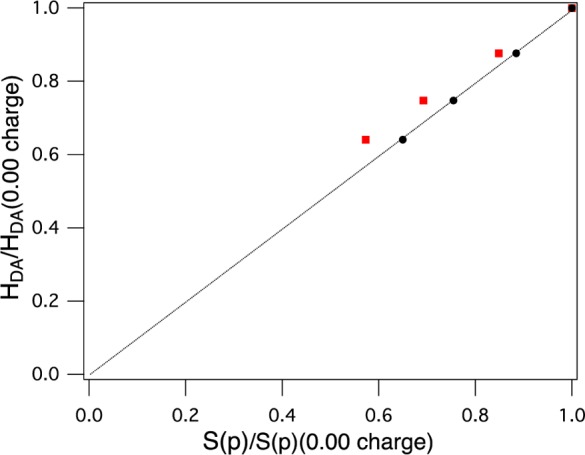
Covalency-activated HDA: linear correlation of HDA with covalency (%S(p)). The line is drawn for a slope of one between HDA and covalency. Values are normalized to no charge (red squares, MPA-derived contributions; black circles, CSPA-derived contributions).