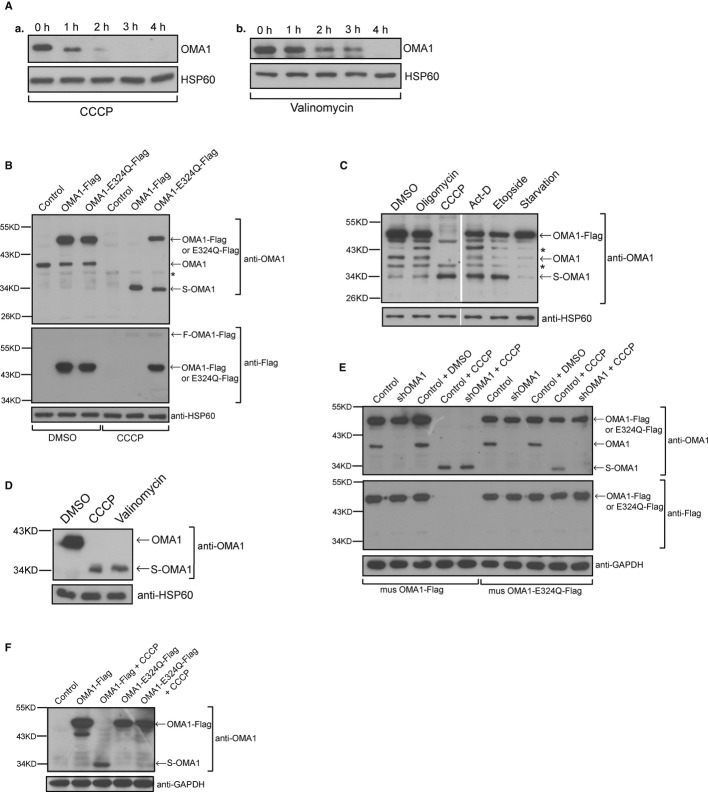
Figure 1. OMA1 is processed by itself in response to membrane depolarization.
A Lysates from HeLa cells treated with 20 μM CCCP (a) or 10 μg/ml valinomycin (b) for the indicated times were analyzed by Western blot with antibodies against OMA1 and HSP60.
B HeLa cells stably expressing mouse OMA1-Flag, OMA1-E324Q-Flag or vector control were treated with DMSO or CCCP for 4 h and the cell lysates were analyzed by Western blot using the indicated antibodies. The asterisk indicates a nonspecific band.
C HeLa cells stably expressing OMA1-Flag were incubated with DMSO, oligomycin (2.5 μM, 4 h), CCCP (20 μM, 4 h), actinomycin D (Act-D, 3 μg/ml, 6 h), etoposide (100 μM, 16 h) or starved for 24 h, respectively, and were probed for OMA1 and HSP60. Asterisks indicate nonspecific bands.
D Purified mitochondrial extracts from 293T cells treated with CCCP (20 μM, 4 h) or valinomycin (10 μg/ml, 4 h) were detected by Western blot using the indicated antibodies.
E HeLa cells stably expressing mouse OMA1-Flag or OMA1-E324Q-Flag plus shRNAi against human OMA1 or vector control were incubated with DMSO or CCCP for 4 h and cell lysates were assessed for the processing of OMA1 by Western blot.
F Lysates from OMA1−/− MEFs expressing OMA1-Flag or OMA1-E324Q-Flag treated with or without CCCP (20 μM, 4 h) were probed for OMA1 and GAPDH.

