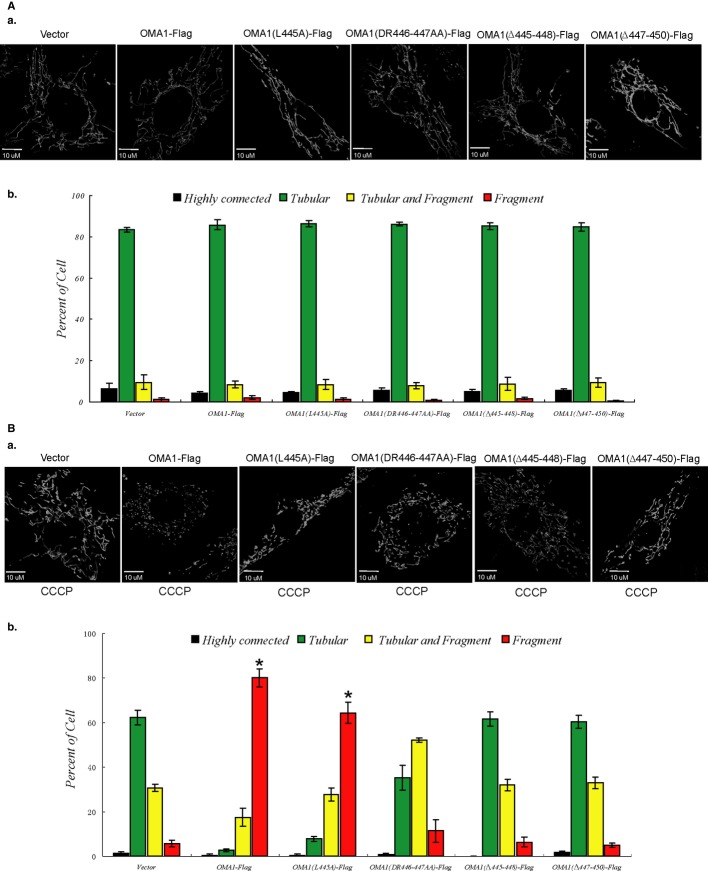
Figure 3. The role of OMA1 processing in regulation of mitochondrial morphology.
A, B OMA1−/− MEFs expressing OMA1-Flag or OMA1 mutation constructs were treated with DMSO (A) or CCCP (20 μM, 30 min) (B); mitochondrial morphology of cells expressing mito-GFP was visualized (a) by confocal microscope and was scored (b) according to the criteria detailed in Materials and Methods; standard deviations (s.d.) from 3 independent experiments in which 100 cell hybrids were scored. For statistical analysis, Student’s t-test was used (*P < 0.05 versus vector). A value of P < 0.05 was considered significant. Statistical significant differences are shown with asterisks.

