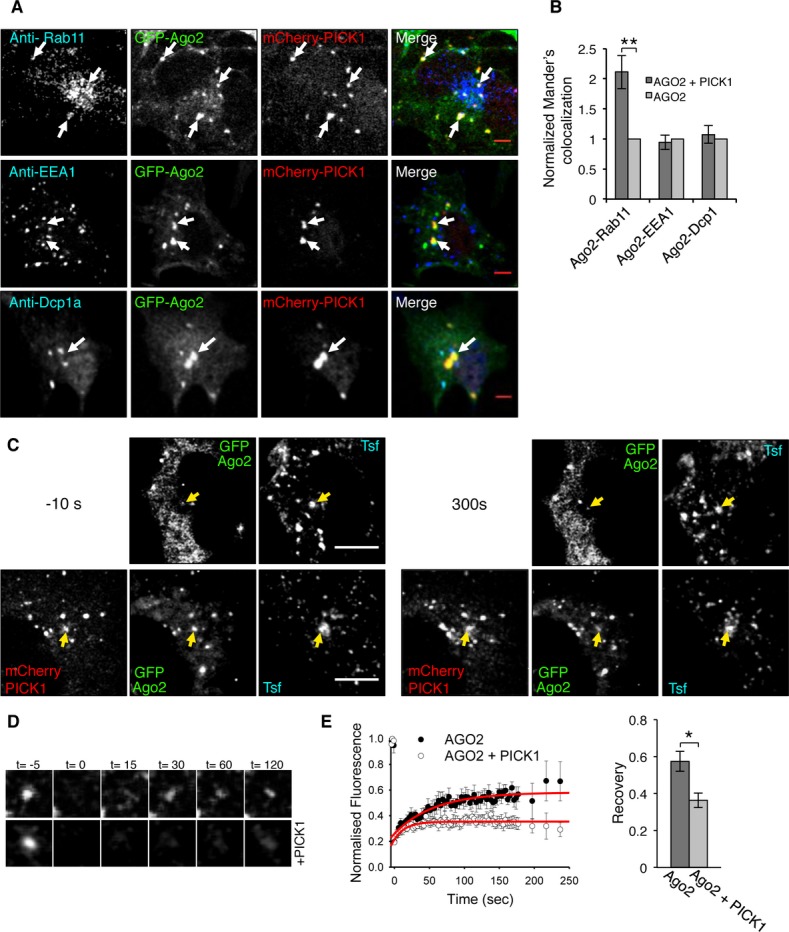
Figure 2. PICK1 promotes Ago2 association with recycling endosomes.

A PICK1 and Ago2 colocalize in Rab11-positive endosomal compartments in COS7 cells. Cells expressing GFP-Ago2 and mCherry-PICK1 were stained using specific antibodies against Rab11, EEA1, or Dcp1a (blue channel). Arrows indicate Ago2 and PICK1 overlapping puncta; scale bar, 5 μm.
B PICK1 co-expression causes an increase in colocalization between Ago2 and Rab11. Colocalization analysis between Ago2 and Rab11, EEA1 or Dcp1a, was performed in COS7 cells expressing either GFP-Ago2 and mCherry-PICK1 or GFP-Ago2 alone. Graph shows Mander’s colocalization coefficients for the fraction of Ago2 colocalized with Rab11, EEA1, or Dcp1a in cells expressing both GFP-Ago2 and mCherry-PICK1 normalized to cells expressing Ago2 alone. **P = 0.0002 (Student’s t-test), n > 30 cells per condition.
C Fluorescence recovery after photobleaching (FRAP) of GFP-Ago2 puncta colocalizing with transferrin-Alexa 647 (Tfn) in the absence or presence of mCherry-PICK1 in COS7 cells; scale bar, 10 μm. Images show cells pre-bleach (−10 s, left panels) and post-recovery (300 s, right panels). Yellow arrows indicate analyzed puncta.
D Representative images of zoomed GFP-Ago2. Time (t) is in seconds; bleaching at t = 0.
E Quantification of FRAP in (C) shows a decrease in recovery of Ago2 in the presence of PICK1. Fluorescence intensity was normalized to pre-bleach values, and fitted curves were used to extract recovery values. *P = 0.04 (Student’s t-test), n = 6–7 cells per condition.
