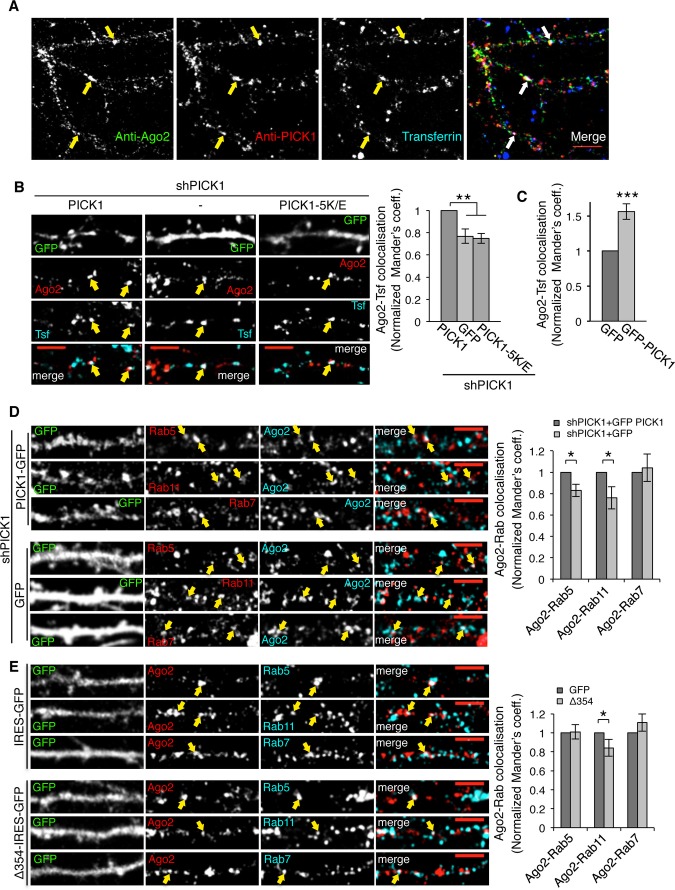
Figure 3. PICK1 promotes Ago2 localization at endosomal compartments in dendrites of hippocampal neurons.
A Endogenous Ago2 and PICK1 are found at transferrin-positive compartments in neuronal dendrites. Neurons were incubated with Alexa-conjugated transferrin to label endosomes and stained with Ago2 and PICK1 antibodies. Arrows indicate colocalizing puncta; scale bar, 10 μm.
B PICK1 knockdown reduces Ago2 colocalization with endosomes. Neurons expressing shPICK1 plus GFP, sh-resistant GFP-PICK WT, or sh-resistant GFP-PICK 5K/E mutant were incubated with Alexa-conjugated transferrin (Tfn) and stained for Ago2. Bottom panels show the merge of Ago2 and Tfn channels. Scale bars, 5 μm. Graph shows Mander’s coefficients for the fraction of Ago2 colocalized with Tfn, normalized to GFP-PICK1 WT rescue condition. Arrows indicate overlapping puncta positive for Ago2 and transferrin. **P < 0.005 (Student’s t-test with Bonferroni correction), n > 10 cells per condition.
C PICK1 overexpression increases Ago2 colocalization with endosomes. Cells expressing GFP or GFP-PICK1 were processed and analyzed as in (B). Representative images are shown in Supplementary Fig S2A. Graph shows Mander’s colocalization coefficients for the fraction of Ago2 colocalized with Tfn, normalized to GFP condition. ***P < 0.001, n > 10 cells per condition.
D PICK1 knockdown reduces Ago2 colocalization with Rab5 and Rab11. Neurons expressing shPICK1 plus GFP or sh-resistant GFP-PICK1 were stained for Ago2 (cyan) and Rab5, Rab11, or Rab7 (red). Far right panels show the merge of Ago2 and Rab channels. Arrows indicate overlapping puncta positive for Ago2 and Rab protein; scale bars, 5 μm. Graph shows Mander’s coefficients for the fraction of Ago2 colocalized with Rab protein, normalized to GFP-PICK1 wild-type rescue condition. n > 8 cells per condition, *P < 0.05 (Student’s t-test), **P < 0.01.
E Δ354 expression reduces Ago2 colocalization with Rab11. Neurons expressing empty-IRES-GFP or Δ354-IRES-EGFP were processed as in (D). Arrows indicate overlapping puncta positive for Ago2 and Rab protein. Graph shows Mander’s coefficients for the fraction of Ago2 colocalized with Rab protein, normalized to GFP control. *P = 0.03 (Student’s t-test), n > 9 cells per condition.
Source data are available online for this figure.

