
Figure 4. LIGHT is upregulated at the site of regeneration following nerve injury.
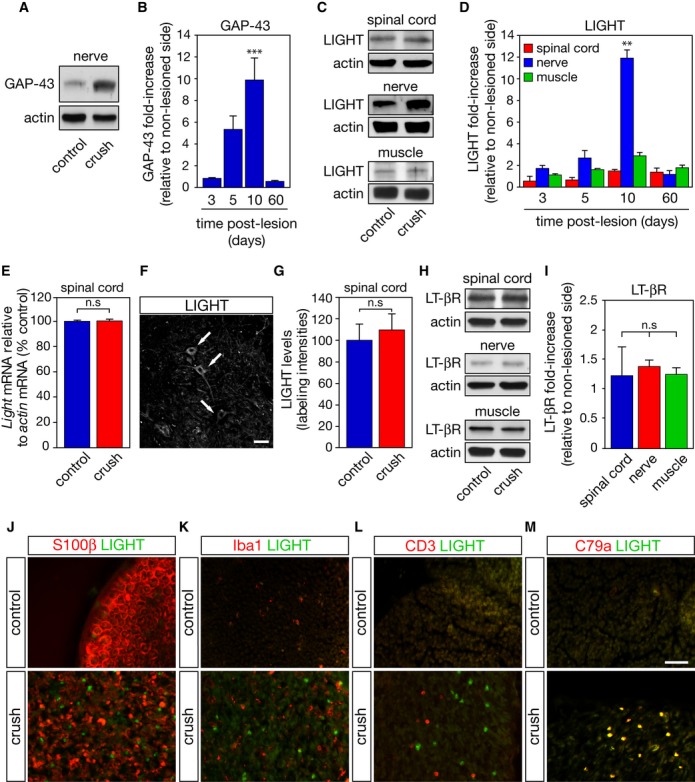
A, B Total levels of GAP-43 were monitored in the sciatic nerve by Western blot (A). GAP-43 band intensities were normalized to their corresponding actin band and expressed as the ratio of lesioned to non-lesion side values (B).
C A representative immunoblot of LIGHT signals in the spinal cord, sciatic nerve, and tibialis anterior muscle 10 days after the nerve lesion.
D At the indicated time, fold increase in LIGHT over sham-operated condition (control) was determined by densitometric analysis of immunoreactive bands, normalized to their respective actin signals.
E qRT-PCR analysis of Light mRNA expression in the spinal cord 10 days following sciatic nerve lesion.
F, G Ten days following a unilateral sciatic nerve crush, LIGHT immunoreactivity in motoneurons (F, arrows; scale bar, 25 μm) in both sham- and operated side was quantified (G).
H, I At the peak of LIGHT expression, LT-βR levels were determined as in (C) and (D).
J–M Ten days after a unilateral crush, sciatic distal nerve sections were co-immunostained for LIGHT, S100β (J), Iba1 (K), CD3 (L), and CD79a (M). Scale bar, 50 μm.
Data information: Results shown in (B, D, I) are the mean values ± SEM, n = 4, ANOVA with Tukey–Kramer’s post hoc test. Results shown in (E) and (G) are means ± SEM, n = 3, unpaired two-tailed Student’s t-test.