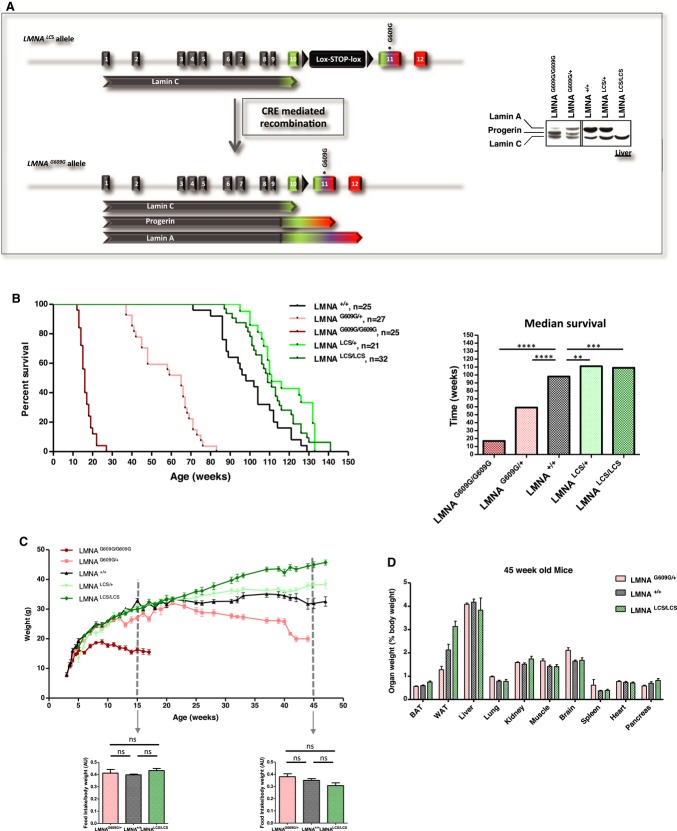
Figure 2. Lmna isoforms, progerin and lamin C, affect lifespan and body weight.
A Left panel, structure of the targeted allele after homologous recombination. Right panel, expression levels of lamin A, progerin, and lamin C protein isoforms in the livers of LmnaG609G/G609G, LmnaG609G/+, Lmna+/+, LmnaLCS/+, and LmnaLCS/LCS, determined by Western blotting.
B Left panel, survival curves of male and female Lmna+/+ (n = 25), LmnaG609G/+ (n = 27), LmnaG609G/G609G (n = 25), LmnaLCS/+ (n = 21), and LmnaLCS/LCS (n = 32) mice. Right panel, histogram showing the median lifespan of each genotype.
C Body weights of male Lmna+/+ (n = 11), LmnaG609G/+ (n = 9), LmnaG609G/G609G (n = 8), LmnaLCS/+ (n = 9), and LmnaLCS/LCS (n = 12) mice. Food intake was measured for 15- and 45-week-old mice (panels below body weight curves).
D Weights of individual organs as a percentage of total body weight for 45-week-old LmnaG609G/+ (n = 15), LmnaLCS/LCS (n = 8), and Lmna+/+ (n = 10) mice.
Data information: Results were expressed as median (B) or means (C and D) ± s.e.m. The significance of differences in lifespan was determined with the log-rank (Mantel–Cox) test.

