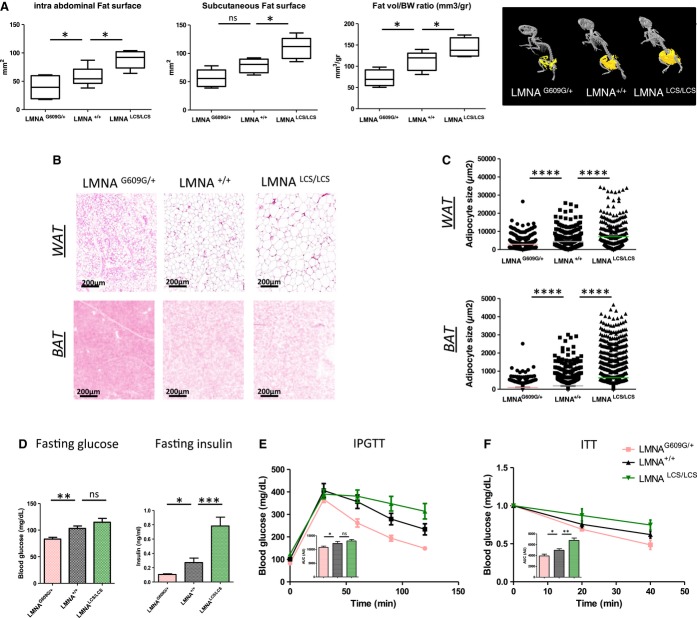
Figure 3. Antagonistic adipose tissue alterations in LmnaG609G/+ and LmnaLCS/LCS mice.
A PET-CT imaging analysis showing quantification of subcutaneous fat surface, intra-abdominal fat surface, and total fat volume normalized to body weight in LmnaG609G/+, Lmna+/+, Lmna LCS/LCS mice (n = 5 per genotype). A representative PET-CT image for each genotype is shown in the right panel.
B Representative images of HE-stained sections of WAT (upper panels) and BAT (lower panels) from Lmna+/+, LmnaG609G/+, and LmnaLCS/LCS mice.
C Quantification of adipocyte size from WAT (upper panel) and BAT (lower panel) with ImageJ software (n = 5 per genotype).
D Metabolic measurements (fasting glucose and insulin, intraperitoneal glucose tolerance test and insulin tolerance test) of Lmna+/+ (n = 6), LmnaG609G/+ (n = 10), and LmnaLCS/LCS (n = 7) mice. Area under the curve for IPGTT and ITT was analyzed (AUC).
Data information: All experiments were conducted using 45-week-old male mice. Results were expressed as means ± s.e.m. The significance of differences was determined with the Student’s t-test.

