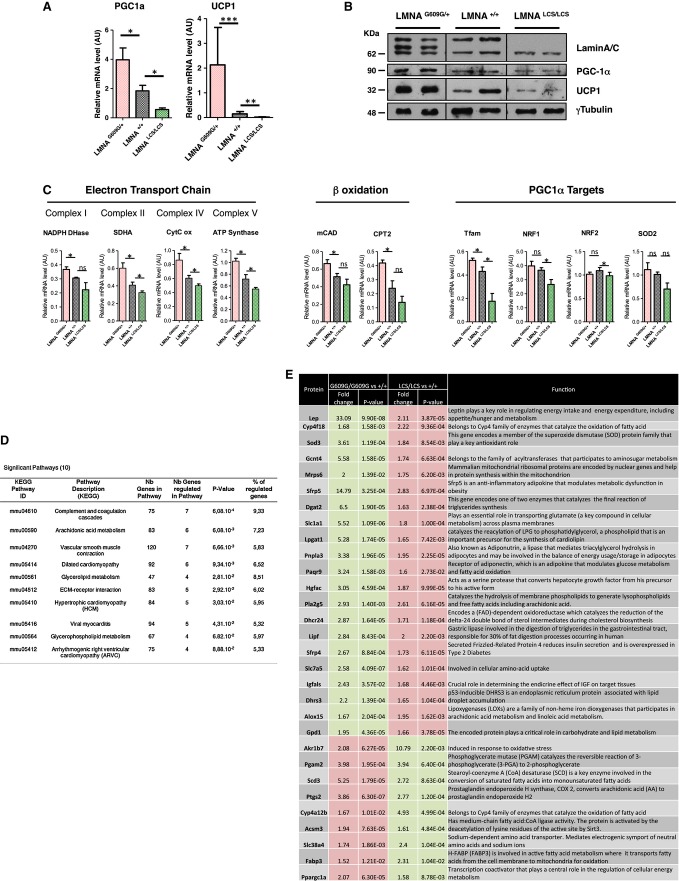
Figure 5. Gene expression profiling of WAT adipose tissue from Lmna mutant mice.
A Relative mRNA levels of PGC1a and UCP1 in WAT were determined by RT–qPCR.
B Protein levels of PGC1a and UCP1 in WAT were determined by Western blotting. Lamin A/C levels and γ-tubulin levels were used as controls.
C Relative mRNA levels of mitochondrial markers in WAT were assessed by RT–qPCR.
D Table representing KEGG pathways significantly and antagonistically regulated by progerin and lamin C derived from exon array analysis of WAT from 18-week-old LmnaG609G/G609G and LmnaLCS/LCS mice (n = 5 per genotype).
E Metabolic genes that are oppositely regulated in WAT from 18-week-old LmnaG609G/G609G and LmnaLCS/LCS mice versus Lmna+/+ mice (n = 5 per genotype). Up-regulated genes are in red boxes, and down-regulated genes are in green boxes.
Data information: RT–qPCR and WB were performed with 45-week-old Lmna+/+, LmnaG609G/+, and LmnaLCS/LCS mice samples (n = 5 per genotype). Results were expressed as means ± s.e.m. The significance of differences was determined with the Student’s t-test. See Supplementary Table S1 for a list of primers used for RT–qPCR.

