
Figure 2.
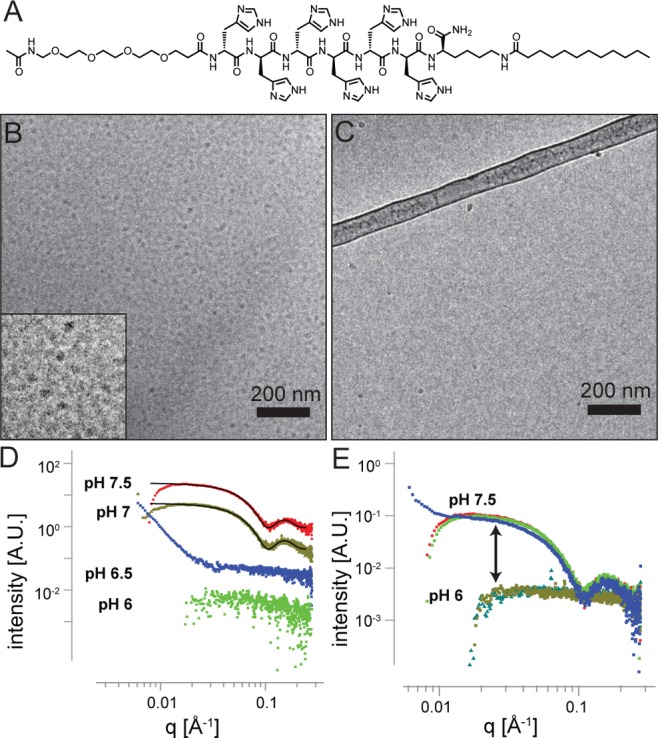
Characterization of OEG-H6K(C12) PA 2. (A) Structure of PA 2. (B) Cryo-TEM of PA 2 at pH 7.5 and 5 mM, with an inset to show a zoomed-in image of the spherical micelles. (C) Cryo-TEM of PA 2 at pH 6.0 and 5 mM. (D) SAXS of PA 2 at varying pH, with a core–shell sphere model shown in black. (E) SAXS reversibility studies of PA 2, where measurements of the same PA solution were taken immediately after each pH change. Each color represents a separate measurement.