
Figure 5.
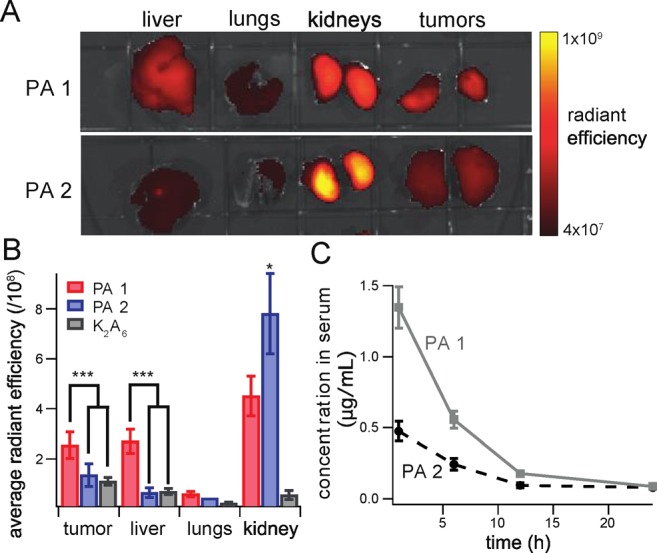
(A) Fluorescent images of biodistribution of AF680-labeled PAs 1 and 2 12 h after tail vein injection. (B) Quantification of average radiant efficiency for each organ in the PAs 1 and 2 and OEG-K2A6K(C12) treatment groups (n = 4). (C) Serum fluorescence in mice treated with PAs 1 or 2 at time 0 (n = 4).