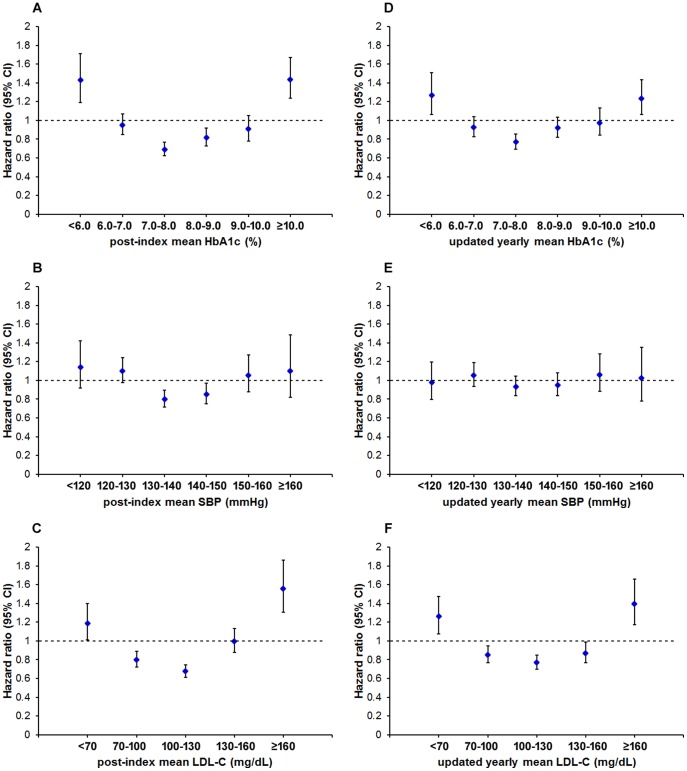
Figure 2. Adjusted hazard ratios for all-cause mortality according to time-fixed or time-dependent HbA1c, SBP and LDL-C levels.
Cox proportional hazards regression analyses were used to calculate hazard ratios relative to the population mean. Potential confounders were adjusted as Model 2 in Table 2, and Model 2,4,6 in Table 3. Vertical error bars indicate 95% confidence intervals.

