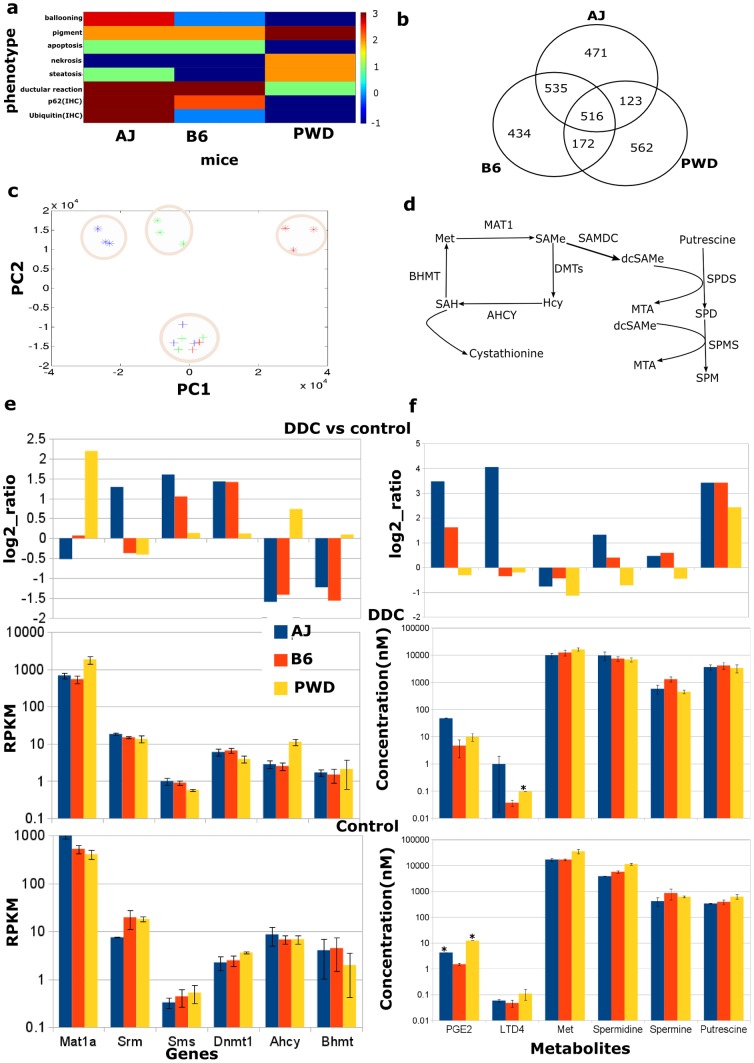
Figure 1. Analysis of phenotypic and omics data.
a) Qualitative scoring of histological phenotypes of the mouse liver samples. Score -1, absent; score 0, minimal; score 1, mild; score 2, moderate; score 3, severe changes compared to healthy liver tissue. Immunohistochemistry, IHC. b) Venn diagram of differentially expressed genes due to DDC treatment in AJ, B6, and PWD mice. c) Principle component analysis (PCA) of 2813 genes that were found differentially expressed for at least one mouse strain due to DDC-treatment. * and + indicate control and DDC mice, respectively; red, green and blue represent AJ, B6, and PWD mice, respectively. Principle component 1 (PC1) explains 43% and PC2 29% of the data. d) S-adenosylmethionine (SAMe) metabolism. Methionine (Met) is converted to SAMe by the enzyme methionine adenosyltransferase (MAT1). SAMe is converted into S-adenosylhomocysteine (SAH) by DNA-methyltransferase (DMTs) and SAH hydrolase (AHCY) with homocysteine (Hcy) as an intermediate. SAH is substrate for Met formation by betaine-homocysteine methyltransferase (BHMT). SAMe can also be converted into spermine (SPM) via decarboxylated SAMe (dcSAMe) and spermidine (SPD) catalyzed by SAMe decarboxylase (SAMDC), SPD synthase (SPDS), and SPM synthase (SPMS). This pathways is regulated by putrescine, which activates SAMDC. e) Arithmetic mean values of RPKM values of aforementioned genes for liver samples of control and DDC-treated mice. Error-bars indicate standard deviations. The bar chart shows log2-ratios of RPKM values of DDC-treated vs control. The genes Mat1a, Srm, Sms, Dnmt1, Ahcy, and Bhmt encode the enzymes MAT, SPDS, SPMS, DMTs, AHCY and BHMT, respectively. f) Bar chart of median concentrations of the metabolites prostaglandin D2 (PGD2), leukotriene D4 (LTD4), methionine (Met), spermidine, spermine, and putrescine. Error-bars indicate median absolute deviations. * indicates samples without a replicate.

