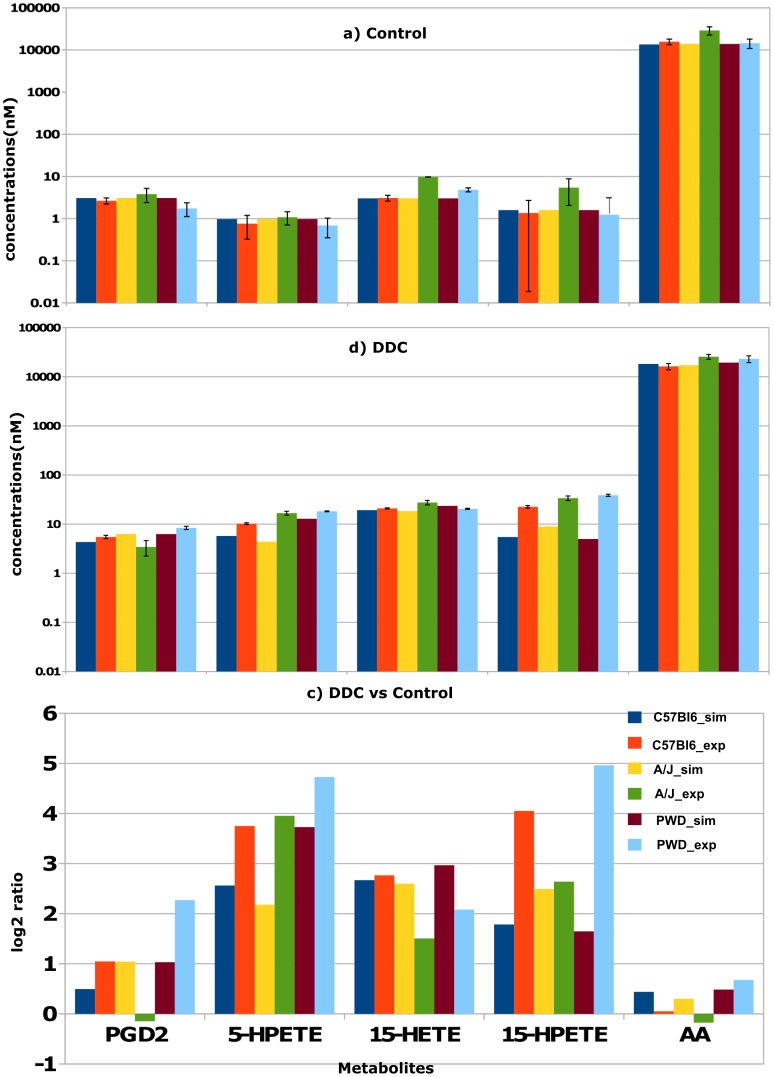
Figure 3. Comparison of simulated steady state and experimental metabolite concentrations.
Quantitative data of simulated and experimental metabolite concentrations of all three mouse strains AJ, B6, and PWD for a) control b) DDC treatment, and c) their respective ratios of the metabolites prostaglandin D2, PGD2; 5- and 15-hydroperoxyeicosatetraenoic acid, 5- and 15-HPETE; 15-hydroxyeicosatetraenoic acid, 15-HETE; and arachidonic acid, AA.

