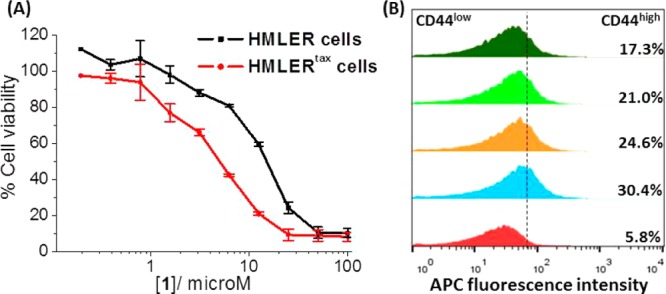
Figure 2.

(A) Average dose–response curves for the treatment of HMLER and HMLERtax cells with 1 (n = 30 for each point). (B) Representative histograms displaying the red fluorescence emitted by anti-CD44 APC antibody-stained HMLER cells (red), HMLERtax cells (blue), and HMLERtax cells treated with 1 (5 μM, orange; 10 μM, light green; 20 μM, dark green) for 4 days followed by 4 days recovery in compound-free MEGM media.
