
Figure 3.
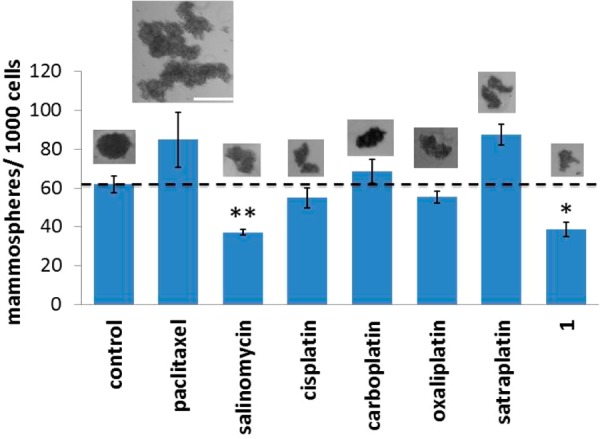
Quantification of mammosphere formation with HMLER cells untreated and treated with the investigated compounds at their respective IC30 values for 5 days. Representative bright-field images (×4) of the mammospheres formed under each condition are presented to scale. Scale bar = 0.3 mm. Student t test, p < 0.05 or p < 0.01. Error bars represent standard deviations.