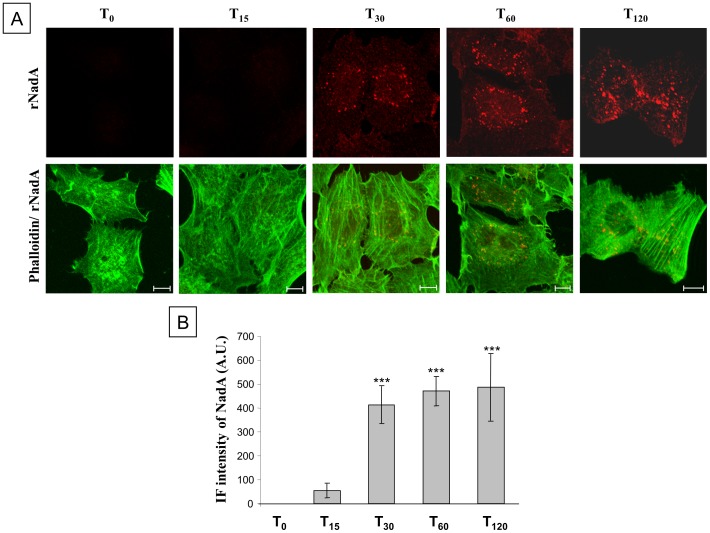
Figure 2. Time course of rNadA internalization.
A: Chang cells were incubated with 200 µg/ml rNadA at 37°C for 0–120 min and then fixed, permeabilized and double stained for rNadA (upper panels; red) and Alexa488-conjugated phalloidin (green). Merged images of rNadA and phalloidin are shown in the lower panel. Scale bar is 10 µm. B: Quantification of IF intensity of rNadA in the experiment illustrated in panel A. Data are mean ± s.e.m representative of two independent experiments, each assessing 10–15 cells, and expressed as Arbitrary Units (A.U.). ***p<0.001, compared to T0 treated cells (t-test).

