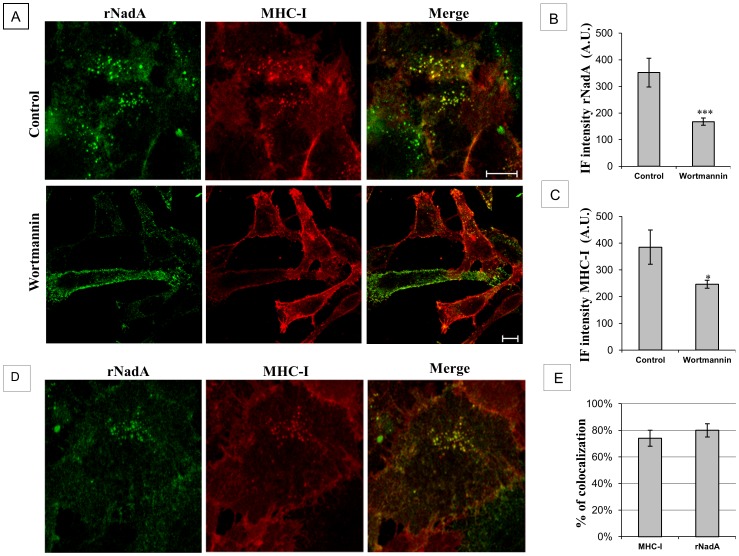
Figure 3. PI3K inhibition impairs rNadA internalization and colocalization of rNadA with MHC-I.
A: Chang cells were treated with either vehicle (upper panel) or 100 nM Wortmannin (lower panel) for 1 h at 37°C, and then incubated with 200 µg/ml rNadA for an additional hour at 37°C in presence of the inhibitor or vehicle. Cells were then fixed, permeabilized and double stained for rNadA (green) and MHC-1 (red). Merged images are also shown. Scale bar 10 µm. B: Quantification of IF intensity of rNadA in the experiment illustrated in panel A. Data are mean ± s.e.m representative of two independent experiments, each assessing 20–25 cells, and expressed as Arbitrary Units (A.U.). ***p<0.001, compared to control cells (t-test). C: Quantification of IF intensity of MHC-I in the experiment illustrated in panel A. Data are mean ± s.e.m representative of two independent experiments, each assessing 20–25 cells, and expressed as Arbitrary Units (A.U.). *p<0.05, compared to control cells (t-test). D: Chang cells were treated with anti-MHC-I antibody for 1 h at 4°C and then incubated at 37°C for 1 h with 200 µg/ml rNadA. Cells were fixed and double stained for rNadA (green) and MHC-1 (red). Scale bar is 10 µm. E: Quantification of MHC-I and rNadA colocalization. MHC-I column indicate the percentage of MHC-I immunofluorescent pixels colocalizing with rNadA immunofluorescent pixels. Conversely, rNadA column indicate the percentage of rNadA immunofluorescent pixels colocalizing with MHC-I immunofluorescent pixels. Data are mean ± s.e.m representative of two independent experiments, each assessing 20–25 cells.

