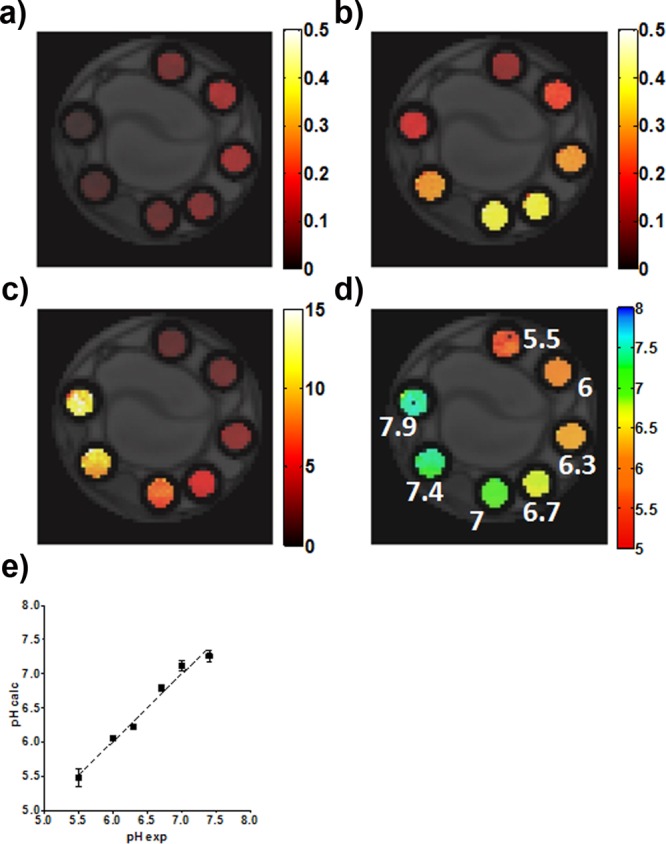
Figure 3.

CEST-MR images of 30 mM iobitridol solution titrated at different pH values (5.5, 6.0, 6.3, 6.7, 7.0, 7.4, 7.9). ST images obtained upon irradiation with RF saturation levels of 1.5 μT (a) and of 6 μT (b). (c) Ratiometric RPM map calculated by using eq 1 from the ratio of the corresponding ST images (a and b). (d) The pH map calculated from the ratiometric map and the calibration curve of Figure 2b; and (e) pH calculated vs pH titrated for 30 mM iobitridol phantoms, R2 = 0.98 (Bo = 7 T, 310 K).
