
Figure 4.
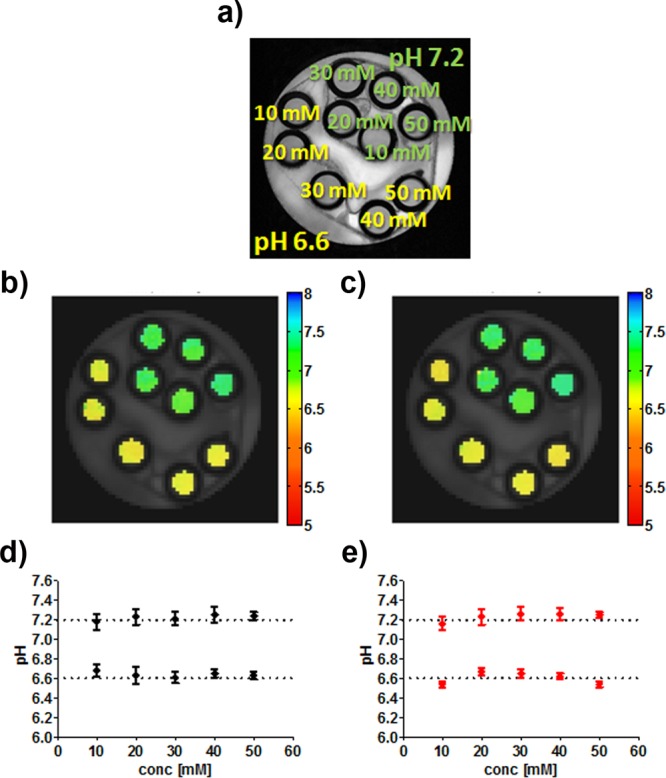
RPM pH mapping is independent of iobitridol concentration. (a) Iobitridol-containing phantoms at different concentrations (10–50 mM) and pH values (6.6 and 7.2). MRI-CEST pH maps calculated by exploiting the RPM approach with RF irradiation powers of 1.5/6 μT (b) and of 3/6 μT (c). Mean pH values calculated for several concentrations upon ratioing 1.5/6 μT (d) and of 3/6 μT (e).