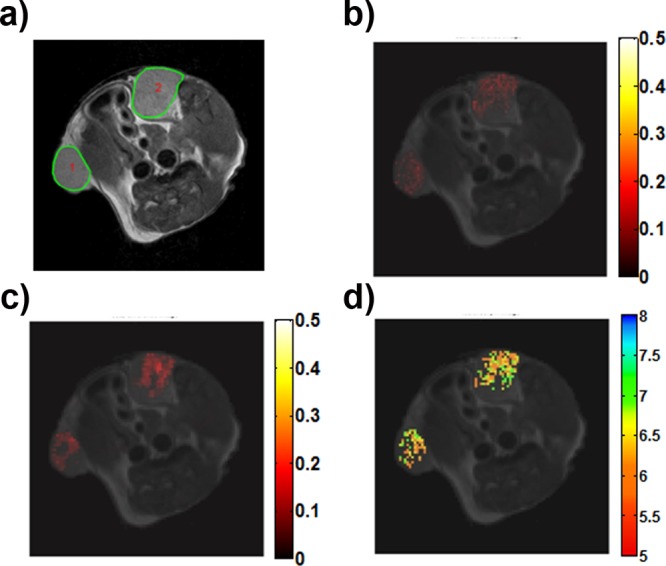
Figure 6.

CEST-MR images of xenografted-tumor bearing mouse following iobitridol i.v. injection (dose 4 g I/kg b.w.). (a) T2w anatomical image with ROIs including the two tumors; CEST contrast difference map between pre- and post-injection following RF irradiation at 1.5 μT (b) and at 6 μT (c). (d) Corresponding pH map obtained upon ratioing the difference ST maps of (b and c). Only tumor signal displayed in color on grayscale image to highlight effects.
