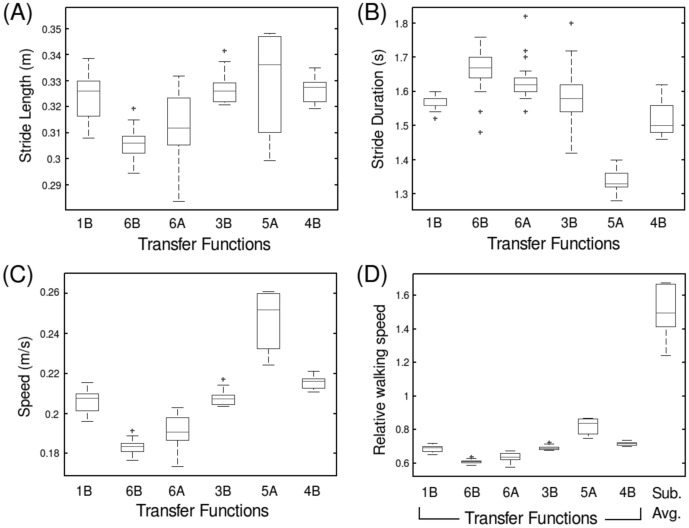
Figure 8. Box plots comparing RunBot's stride length (A), stride duration (B) and walking speed (C).
Using the transfer function sets which produced stable walking (n = 10). A box plot comparing the relative walking speed of RunBot using each of the transfer function sets compared to the average relative walking speed of the human test subjects is also provided (D). Relative walking speed of leg-length/s is calculated as the scaled walking speed to leg length where RunBot's leg length is 0.3 m.

