
Figure 3.
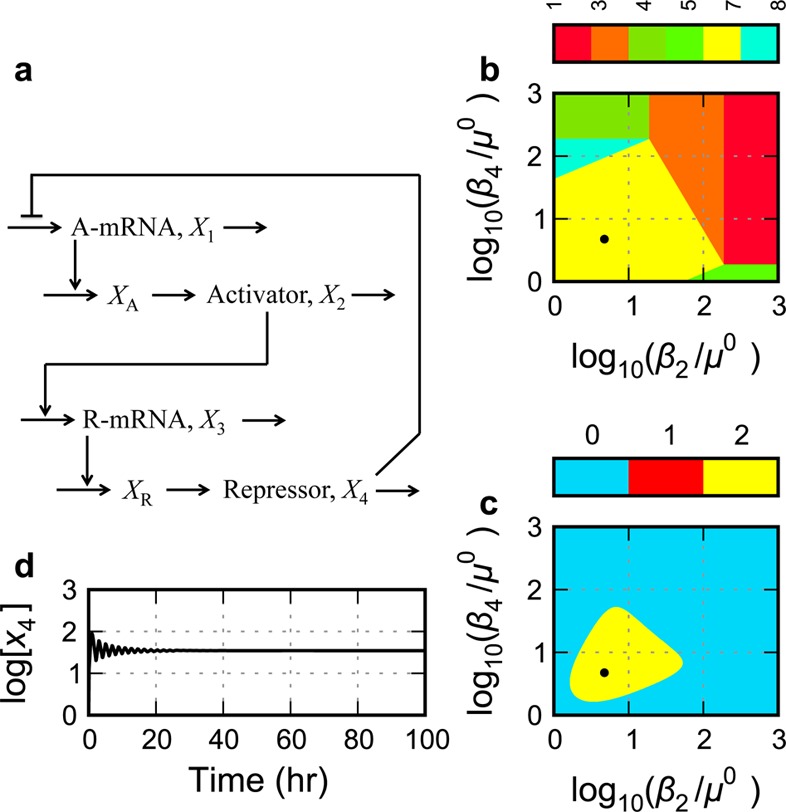
Gene circuit with a single negative feedback. (a) Circuit architecture with repressor-only control of activator transcription and activator-only control of repressor transcription. (b, c) System design space with the effective rate constant for inactivation of the activator, β2, represented on the horizontal axis and that for the repressor, β4, on the vertical axis. (b) Enumeration of the qualitatively distinct phenotypes identified by color, where the color bar represents the case number for each of the qualitatively distinct phenotypes. (c) The phenotypic trait represented as a heat map on the z axis of the system design space is the number of eigenvalues with positive real part. The color bar in this case represents the value of the phenotypic trait: blue for zero eigenvalues with positive real part (monostability), red for one eigenvalue with positive real part (bistability), and yellow for two complex eigenvalues with positive real part (unstable focus). (d) Temporal behavior of the full GMA system at the nominal operating point (●) within the region having the potential for sustained oscillation.