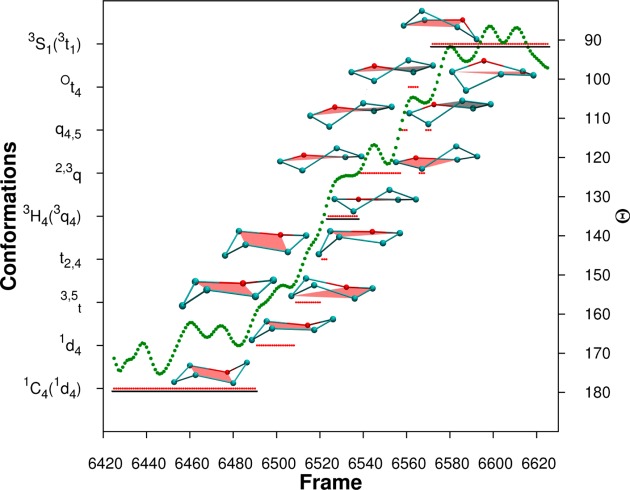
Figure 8.
Frames, corresponding to 200 fs, extracted from the MD simulation shown in Figure 7. The BFMP descriptors are shown by red lines. The lines are underlined for shapes that can be identified as standard IUPAC conformations 1C4, 3H4, and 3S1. Cremer-Pople θ values are plotted as green dots. Schematic representations of the BFMP-defined conformations, in order of occurrence, during the transition from 1C4 to 3H4 to 3S1 conformations are also shown. The structures shown to the left of the green dots are oriented with respect to the IUPAC reference planes, and the structures shown on the right are oriented to reference planes used by BFMP.

